Transcription of repeated-measures within-participants - Open University
1 One-Way repeated -Measures anova . Analysis of Variance ( anova ) is a common and robust statistical test that you can use to compare the mean scores collected from different conditions or groups in an experiment. There are many different types of anova , but this tutorial will introduce you to One-Way repeated -Measures anova . A repeated -measures (or within-participants ) test is what you use when you want to compare the performance of the same group of participants in different experimental conditions. That is, when the same participants take part in all of the conditions in your study.
2 The term one-way simply to refers to the number of independent variables you have; in this case, one. You would use this test when you have the following: one dependent variable one independent variable (with 3 or more conditions). each participant takes part all conditions This tutorial will show you how to run and interpret the output of a one-way repeated - measures anova using SPSS. Worked Example Let's consider a simple memory experiment. Imagine that you are a researcher who is interested in factors that influence people's ability to remember lists of words.
3 Specifically, you want to know whether the relatedness of the words on the list influence people's ability to remember them. As part of this study, participants could be given several different word lists to learn. The word lists would need to be matched for length and frequency of use, but would vary according to how the words related to one another (the independent variable). Participants would have to learn all three versions of the lists: Unrelated words Semantically related words Phonemically related words The number of words the remembered would be taken as the dependent variable.
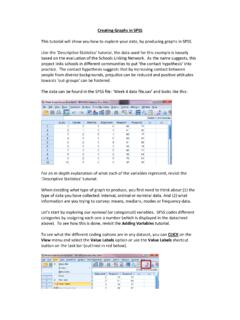
4 This what the data looks like in SPSS. It can also be found in the SPSS file: Week 2 Words '. As a general rule in SPSS, each row in the spreadsheet should contain all of the data provided by one participant. In a repeated measures design, this means that separate columns need to represent each of the conditions of the experiment. In this example, we have one IV with three levels, which means we need to have at least three columns of data. Note that this differs from a between-participants design, where the conditions of the IV are coded in a separate column.
5 In this example, the different columns display the following data: id : This just refers to the ID number assigned to the participants. We use numbers as identifiers instead of participant names, as this allows us to collect data while keeping the participants anonymous. unrelated: This column displays the number of words that participants successfully remembered from the list made up from unrelated words semantic: This column displays the number of words that participants successfully remembered from the list made up from semantically related words phonological.
6 This column displays the number of words that participants successfully remembered from the list made up from phonologically (or phonemically) related words To start the analysis, begin by CLICKING on the Analyze menu, select the General Linear Models, and then the repeated Measures sub-option. The repeated Measures Define Factor(s) box should now appear. This is where we tell SPSS. what our repeated measures IV is, and how many levels it has. In this case, let's call our IV. mouth_visibility by entering this into the Within-Subject Factor Name box.
7 We can then tell SPSS that there are 3 levels to this IV, using the Number of Levels box. Once you have told SPSS your variable name, and how many levels (or conditions) it has, CLICK. on Add to add it to your analysis (see image above). Then CLICK on Define to continue. This opens the repeated Measures dialog box. In the Within-Subjects Variables window you can see a series of question marks with bracketed numbers. SPSS will use these numbers to represent the different levels of our IV. Your task is to replace the question marks with the names of the conditions that match the variable levels.
8 To do this, highlight all of the condition names in the box, as is shown above. When doing this yourself, remember that if you hold down the Ctrl key so you can highlight them all in one go. Now CLICK on the top blue arrow to move them across. By moving the conditions across in this way you are basically telling SPSS to code your variable conditions as follows: 1 = unrelated 2 = semantic 3 = phonological Now we have told SPSS what is it that we want to analyse, we are almost ready to run the anova . But first, we need to ask SPSS to produce some other information for us, to help us better understand our data.
9 First, it's often a good idea to illustrate your data by producing a graph. To do this, CLICK on the Plots button on the right of the Univariate dialog box. This opens the Profile Plots box. The variable Word_List should already be selected for you. CLICK on the arrow to the left of the Horizontal Axis box to add this variable to the plot. Then CLICK Add. Once this variable is added to the Plots window (as above), CLICK Continue. Next, we need to tell SPSS exactly what information we want it to produce as part of the anova . CLICK on the Options button in the Univariate box to do this.
10 To produce information for the independent variable and its conditions, SELECT Word_List in the Factors(s) box and move it across to the Display Means for box by CLICKING on the blue arrow. Next, SELECT the Compare main effects box. By doing this you can now choose some Post Hoc tests1 to carry out by CLICKING on the Confidence interval adjustment drop down menu. This gives you three tests to choose from. In this case, SELECT Bonferroni. In the bottom half of the Options dialog box, there are a number of tick box options that you can choose from.