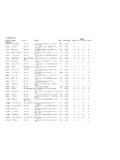
Transcription of Reported Annual Abortions ABORTION statistics
1 Reported Annual Abortions 1973 - 2014. ABORTION . statistics United States Data and Trends Lowest Levels in Decades There are two basic sources on ABORTION incidence in the United States: The Centers for Disease Control (CDC) publishes yearly, but relies on voluntary reports from state health 1973 744,610 615,831 departm ents (and New York City, W ashington, ). It 1974 898,570 763,476 has been m issing data from California, New Hampshire, 1975 1,034,170 854,853 and at least one other state since 1998. 1976 1,179,300 988,267 The Guttm acher Institute (GI) contacts ABORTION clinics 1977 1,316,700 1,079,430 directly for data but does not survey every year. 1978 1,409,600 1,157,776 Because it surveys clinics directly and includes data 1979 1,497,670 1,251,921 from all fifty states, m ost researchers believe 1980 1,553,890 1,297,606. Guttm acher's numbers to be m ore reliable, though 1981 1,577,340 1,300,760.
2 Guttm acher still believes there m ay be as m uch as a 5% undercount in its m ost recent figures. 1982 1,573,920 1,303,980. Both the CDC and Guttm acher show significant recent 1983 1,575,000 1,268,987. drops and even larger drops over the last 25 years. 1984 1,577,180 1,333,521. Total Abortions dropped from 1998 to 2014 with 1985 1,588,550 1,328,570. the CDC, and fell from 1990 to 2014 with GI. 1986 1,574,000 1,328,112. Total Abortions fell below 1 m illion for the first tim e in 1987 1,559,110 1,353,671. 38 years for Guttm acher when it Reported 958,700 for 1988 1,590,750 1,371,285. 2013. That dropped further to 926,190 in 2014. 1989 1,566,900 1,396,658. The ABORTION rate for 2014 for GI was Abortions 1990 1,608,600 1,429,247. for every 1,000 wom en of reproductive age (15-44), 1991 1,556,510 1,388,937. half what it was in 1981 ( ) and the lowest recorded 1992 1,528,930 1,359,146.
3 Since ABORTION was legalized in the in 1973. 1993 1,495,000 1,330,414. Guttm acher says there were Abortions for every 1994 1,423,000 1,267,415. 100 pregnancies ending in live birth or ABORTION in 1995 1,359,400 1,210,883. 2014, an ABORTION ratio lower than any since 1972. 1996 1,360,160 1,225,937. Guttm acher says that the num ber of ABORTION 1997 1,335,000 1,186,039. providers has dropped from a high of 2,918 in 1982. 1998 1,319,000 884,273* to 1,671 in 2014. 1999 1,314,800 861,789* Most of the reduction in Abortions seen between 2008. 2000 1,312,990 857,475* and 2011 was in facilities perform ing a thousand or 2001 1,291,000 853,485* m ore Abortions a year. A loss of 65 m ore such facilities 2002 1,269,000 854,122* from 2011 to 2014 was likely a big factor in the overall 2003 1,250,000 848,163* drop of 132,300 Abortions seen in those three years.
4 2004 1,222,100 839,226*. 2005 1,206,200 820,151*. 2006 1,242,200 846,181*. The Consequences of Roe v. Wade 2007 1,209,640 827,609*. 60,069,971. 2008 1,212,350 825,564*. 2009 1,151,600 789,116*. 2010 1,102,670 765,651*. 2011. 2012. 1,058,490. 1,011,000. 730,322*. 699,202* *excludes NH, CA. Total Abortions since 1973. and at least one 2013 958,700 664,435* other state Based on num bers Reported by the Guttm acher Institute 1973-2014, 2014 926,190 652,639* with projections of 926,190 for 2015-17. GI has estim ated possible undercounts of 3-5% , so an additional 3% is factored into the overall total. 1/18. 2015-17 926,190 NRLC projection for calculatio