Transcription of Reporting Research Findings - NUS
1 27 Reporting Research Findings44 Reporting Research Findings Very often, you will have to write reports, which are documents containing factual and objective information that you have collected through Research . Analytical Research reports, which are written after having gathered important information from primary Research resources such as surveys or experiments, rather than published documents, present original data that you collect and analyse. Learning to write them well, especially the Results and Discussion section, sometimes called Findings or simply Results, is an important skill you will need to learn. This chapter suggests ways to write the Results and Discussion section of analytical reports in effective and convincing ways. To accomplish this, you will need to do the following: Use text and visual aids properly Interpret results Use headings and sub-headings Use language of Reporting appropriately Refer to fi gures correctly Use Text and Visual Aids Properly In the Results section, you are expected to present the data in words with the help of tables, charts and graphs to make your data clear and easy to understand.
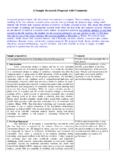
2 However, you should remember that you write a report; you do not draw a report. The text is primary. The graphics support the text. Figure 1 shows, on the left, an inappropriate Reporting of results merely with a heading and a chart and, on the right, the appropriate way of Reporting fi ndings, that is, using text (a paragraph or more) and drawing the reader s attention to a fi gure that makes the description clearer. Note that the chart is located after the text which explains it. 277/12/09 10:36:39 AM7/12/09 10:36:39 AM28 Reporting Research Findings Note that simple fi ndings usually do not need a visual aid, nor do you need a visual aid for every fi nding. Visual aids are usually used to make complex fi ndings explained in the text easier to grasp. However, there are simple but crucial fi ndings and visuals are sometimes created to give these facts more impact or emphasis, as above.
3 Remember that in the Results section you need to be objective. That is, you need to report your fi ndings without any biased comment or slant. An example of biased Reporting is as follows: The survey shows that an overwhelming percentage of the respondents 83% feel that punishing cyberbullies is not necessary, a disappointing fi nding. You will notice that the words in bold betray the writer s feelings and attitude towards the subject under discussion. Such comments should be avoided. Figure 1: Inappropriate and appropriate ways of Reporting fi ndingsYes No21%79%Yes No21%79%Figure 2: Percentage of respondents who know how to do CPR Letting a visual do the Extent of knowledge of CPR Reporting a survey fi nding using a paragraph (or two) and referring to a visual aid that helps to show the fi nding Extent of knowledge of CPR As can be seen from Figure 2, only 21% of the respondents reported knowing how to administer CPR.
4 Figure 2: Percentage of respondents who know how to do CPRThis is a surprising fi nding considering the many opportunities offered to the public to learn emergency procedures. This fi nding may also be deemed worrying given that government efforts to train the public to be ready for emergencies are central to the concept of total 287/12/09 10:36:40 AM7/12/09 10:36:40 AM29 Reporting Research Findings Interpret Results Reporting data involves more than just presenting it. Often, you need to interpret or analyse the data, that is, say what it means, especially in relation to your Research question. For example, if your Research objective was to determine how successful the community centres (CCs) are in attracting young people, you would have to present what you had found out about the response of young people to programmes organised for them in the CCs and say what this could mean vis- -vis your Research question, for example, How successful are government efforts in promoting the community centres to young people?
5 A complete Reporting could look like this: A large proportion of the respondents 74% reported that the programmes organised in the CCs do not meet their needs, mainly because the programmes are not attractive enough [result/fi nding]. This does not augur well for government efforts to promote the CCs as a focal point for young people [interpretation]. Table 1 shows the difference between Reporting and interpreting data Only 26% reported knowing how to perform emergency procedures like mouth-to-mouth majority of the respondents (75%) said that they had to wait for more than half an hour before being able to board bus service 151 in the morning, between and Interpreting data This fi nding shows how unprepared Singaporeans are in emergencies and illustrates that perhaps efforts to provide emergency training for Singaporeans need to be stepped up.
6 The fi nding indicates that the frequency of bus service 151 in the morning peak hours is 1: Reporting and interpreting dataYou should rememberthat you write a report;you do not drawa text is graphics supportthe 297/12/09 10:36:41 AM7/12/09 10:36:41 AM30 Reporting Research Findings Use Headings and Subheadings The section in which you present and interpret fi ndings can go over several pages in some reports. In this case, you will need to use subheadings to indicate clearly what the fi ndings are. For instance, if your survey is on people s experience with recycling, and your survey had questions related to their practice of recycling, you might divide your Results section according to what the survey found, using headings like these: 2. Results and Discussion Frequency of recycling Reasons for not recycling Ways to improve recycling Choose appropriate type of headings There are two types of headings: talking and topic headings.
7 Talking headings present a certain point of view whilst topic headings list only the topic to be discussed. You may want to use a combination of both in your report, as the following example illustrates: Reasons for not recycling Topic heading Inconvenient location of recycling bins Talking headings Inadequate encouragement to recycle Keep your headings parallel Remember also to keep headings of the same level under the same section parallel. In the example above, the headings for , and (all second-level headings under the Results and Discussion section) are parallel in that they are all noun phrases; they are also of the same type, topic headings. Similarly, the headings at and (third-level headings under the section Reasons for not recycling) are parallel grammatically and are both talking headings.
8 307/12/09 10:36:41 AM7/12/09 10:36:41 AM31 Reporting Research Findings Number your sections consistently In numbering the sections of your report, you can choose either the decimal system or the alphanumeric system but you must be consistent and not mix them. The decimal system uses numbers with increasing decimal places for lower level information. The alphanumeric system is a combination of the roman numerals and the alphabet. The table below illustrates the two numbering system 2. Results and Discussion Frequency of recycling Reasons for not recycling Inconvenient location of recycling bins Inadequate encouragement to recycle Ways to improve recyclingTable 2: The decimal and alphanumeric numbering systemsAlphanumeric system A.
9 Results and Discussion i) Frequency of recycling ii) Reasons for not recycling a) Inconvenient location of recycling bins b) Inadequate encouragement to recycle iii) Ways to improve recycling Use Language of Reporting Appropriately Very often, when student writers report on information obtained from primary Research , they do not use the appropriate forms of expression. Table 3 shows some examples of inappropriate and appropriate language of From the survey, 40% of the respondents (It is not from the survey that the respondents feel or think a certain way.) From the study, not many From interviews with students, they do not benefi t Through my dealings with employees, they are concerned mostly (The subject following through my dealings with employees should be I not they.
10 Table 3: Inappropriate and appropriate ways of Reporting dataAppropriate The survey shows that 40% of the respondents The study tells us that not many the study, we can see that not many From interviews with students, it can be seen that/it was found that they do not benefi t Through my dealings with employees, I fi nd that they are concerned mostly My dealings with employees show that they are concerned mostly 317/12/09 10:36:41 AM7/12/09 10:36:41 AM32 Reporting Research Findings Here are four possibilities of structurally appropriate Reporting : The survey [source] shows that [fi nding] It can be seen [writer s voice/comment] from the survey [source] that [fi nding] From the survey [source], it was found that [fi nding] The majority [fi nding], as can be seen from the responses to a question [source] Another common error occurs when presenting what the respondents say or feel.
![Guide to Application Form [International Students]](/cache/preview/8/9/a/0/5/0/1/3/thumb-89a050137b2263103e521b3c6af21944.jpg)