Transcription of RESULTS OF OPERATIONS Net sales 20,170$ 19,312$ 12,480 ...
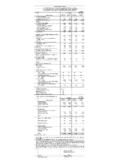
1 9 MonthsendedSeptember 30, 20132014201520162017 RESULTS OF OPERATIONSNet sales 20,170$ 19,312$ 12,480 $ 10,090$ 9,016$ Income (loss) from continuing OPERATIONS (b)4,932$ (130)$ (8,146)$ (1,002)$ 814$ Net income (loss) attributable to common stock5,903$ 616$ (7,829)$ (574)$ 814$ Earnings (loss) per share attributable to common stockBasic earnings (loss) per common share from continuing OPERATIONS (b) $ ( )$ ( )$ ( )$ $ Basic earnings (loss) per common share (b) $ $ ( )$ ( )$ $ Diluted earnings (loss) per common share (b) $ $ ( )$ ( )$ $ Core RESULTS (a)4,644$ 3,783$ 91$ (771)$ 373$ FINANCIAL POSITIONT otal assets69,415$ 56,237$ 43,409$ 43,109$ 41,443$ Long-term debt, net (including current maturities)6,911$ 6,816$ 8,305$ 9,819$ 9,826$ Stockholders' equity43,372$ 34,959$ 24,350$ 21,497$ 20,669$ CASH FLOW FROM CONTINUING OPERATIONSO perating:Cash flow from continuing operations10,229$ 8,871$ 3,254$ 2,519$ 3,575$ Investing:Capital expenditures(7,357)$ (8,930)$ (5,272)$ (2,717)$ (2,439)$ Cash provided (used) by all other investing activities, net1,040$ 2,686$ (151)$ (2,025)$ 178$ Financing.
2 Cash dividends paid(1,553)$ (2,210)$ (2,264)$ (2,309)$ (1,754)$ Purchases of treasury stock(943)$ (2,500)$ (593)$ (22)$ (12)$ Cash provided (used) by all other financing activities, net(437)$ 2,384$ 4,341$ 2,722$ 25$ Dividends per common $ $ $ $ $ Weighted average shares outstanding (millions)Basic Diluted (b) Represents amounts attributable to common stock after deducting noncontrolling interest the twelve months ended December 31,(Dollar amounts in millions, except per-share amounts)Summary of Selected Financial Data(a) Occidental's RESULTS of OPERATIONS often include the effects of significant transactions and events affecting earnings that vary widely and unpredictably in nature, timing and amount.
3 These events may recur, even across successive reporting periods. Therefore, management uses a measure called "core RESULTS " which excludes those items. This non-GAAP measure is not meant to disassociate those items from management's performance, but rather is meant to provide useful information to investors interested in comparing Occidental's earnings performance between periods. Reported earnings are considered representative of management's performance over the long term. Core RESULTS is not considered to be an alternative to operating income in accordance with generally accepted accounting MonthsendedSeptember 30, 20132014201520162017 REVENUESNet sales Oil and gas 15,008$ 13,887$ 8,304$ 6,377$ 5,607$ Chemical 4,673 4,817 3,945 3,756 3,295 Midstream and Marketing1,174 1,373 891 684 747 Eliminations (a)(685) (765) (660) (727) (633)
4 20,170 19,312 12,480 10,090 9,016 Interest, dividends and other income107 130 118 106 72 Gain on sale of assets and equity investments, net1,175 2,505 101 202 598 21,452 21,947 12,699 10,398 9,686 COSTS AND OTHER DEDUCTIONSCost of sales 6,497 6,803 5,804 5,189 4,269 Depreciation, depletion and amortization 4,203 4,261 4,544 4,268 2,926 Selling, general and administrative and other operating expenses1,544 1,503 1,270 1,330 976 Asset impairments and related items621 7,379 10,239 825 24 Taxes other than on income564 550 343 277 221 Exploration expense140 150 36 62 27 Interest and debt expense, net132 77 147 292 258 13,701 20,723 22,383 12,243 8,701 INCOME (LOSS) BEFORE INCOME TAXES AND OTHER ITEMS7,751 1,224 (9,684) (1,845) 985 Benefit (provision) for domestic and foreign income taxes (3,214) (1,685) 1,330 662 (448) Income from equity investments395 331 208 181 277 INCOME (LOSS) FROM CONTINUING OPERATIONS4,932 (130) (8,146) (1,002)
5 814 Discontinued OPERATIONS , net 971 760 317 428 - NET INCOME (LOSS)5,903 630 (7,829) (574) 814 Less: Net income attributable to noncontrolling interest- (14) - - - NET INCOME (LOSS) ATTRIBUTABLE TO COMMON STOCK5,903$ 616$ (7,829)$ (574)$ 814$ EARNINGS PER SHARE (attributable to common stock)BASIC EARNINGS (LOSS) PER COMMON SHAREI ncome (loss) from continuing $ ( )$ ( )$ ( )$ $ Discontinued OPERATIONS , - BASIC EARNINGS (LOSS) PER COMMON $ $ ( )$ ( )$ $ DILUTED EARNINGS (LOSS) PER COMMON SHARE Income (loss) from continuing $ ( )$ ( )$ ( )$ $ Discontinued OPERATIONS , - DILUTED EARNINGS (LOSS) PER COMMON SHARE $ $ ( )$ ( )
6 $ $ DIVIDENDS PER COMMON $ $ $ $ $ (a) Intersegment sales eliminate upon consolidation and are generally made at prices approximating those that the selling entity would beable to obtain in third-party the twelve months ended December 31,(Amounts in millions, except per-share amounts)Consolidated Statement of Operations31-Dec-1331-Dec-1431-Dec-1531- Dec-1630-Sep-17 CURRENT ASSETSCash and cash equivalents 3,393$ 3,789$ 3,201$ 2,233$ 1,806$ Restricted cash- 4,019 1,193 - - Trade receivables, net 5,674 4,206 2,970 3,989 3,749 Inventories1,200 1,052 986 866 1,007 Assets held for sale- - 141 - - Other current assets1,056 807 911 1,340 483 Total current assets11,323 13,873 9,402 8,428 7,045 INVESTMENTS Investments in unconsolidated entities 1,459 1,171 1,267 1,401 1.
7 526 Available for sale investment - 394 167 - - Total investments1,459 1,565 1,434 1,401 1,526 PROPERTY, PLANT AND EQUIPMENTOil and gas segment72,367 59,061 55,025 54,673 53,333 Chemical segment6,446 6,574 6,717 6,930 7,035 Midstream and marketing segment8,684 8,304 8,899 9,216 9,490 Corporate1,555 576 417 474 457 89,052 74,515 71,058 71,293 70,315 Accumulated depreciation, depletion and amortization(33,231) (34,785) (39,419) (38,956) (38,250) 55,821 39,730 31,639 32,337 32,065 LONG-TERM RECEIVABLES AND OTHER ASSETS, NET 812 1,069 934 943 807 TOTAL ASSETS69,415$ 56,237$ 43,409$ 43,109$ 41,443$ CURRENT LIABILITIESC urrent maturities of long-term debt-$ -$ 1,450$ -$ 500$ Accounts payable5,520 5,229 3,069 3,926 3,734 Accrued liabilities 2,556 2,601 2,213 2,436 2,128 Domestic and foreign income taxes 358 414 - - - Liabilities of assets held for sale- - 110 - - Total current liabilities8,434 8,244 6,842 6,362 6.
8 362 LONG-TERM DEBT, NET 6,911 6,816 6,855 9,819 9,326 DEFERRED CREDITS AND OTHER LIABILITIESD eferred domestic and foreign income taxes 7,197 3,015 1,323 1,132 978 Other 3,501 3,203 4,039 4,299 4,108 10,698 6,218 5,362 5,431 5,086 STOCKHOLDERS EQUITY Common stock, $.20 per share par value178 178 178 178 179 Treasury stock(6,095) (8,528) (9,121) (9,143) (9,154) Additional paid-in capital7,515 7,599 7,640 7,747 7,850 Retained earnings 41,831 36,067 25,960 22,981 22,032 Accumulated other comprehensive loss(303) (357) (307) (266) (238)
9 Total equity attributable to common stock43,126 34,959 24,350 21,497 20,669 Noncontrolling interest246 - - - - Total equity43,372 34,959 24,350 21,497 20,669 TOTAL LIABILITIES AND STOCKHOLDERS' EQUITY69,415$ 56,237$ 43,409$ 43,109$ 41,443$ Consolidated Balance Sheets (Amounts in millions)9 MonthsendedSeptember 30, 20132014201520162017 CASH FLOW FROM OPERATING ACTIVITIESNet income (loss)5,903$ 630$ (7,829)$ (574)$ 814$ Adjustments to reconcile net income (loss) to net cash provided by operating activities:Discontinued OPERATIONS , net(971) (760) (317) (428) - Depreciation, depletion and amortization of assets4,203 4,261 4,544 4,268 2,926 Deferred income tax provision (benefit)914 (1,178) (1,372) (517) (111) Other noncash charges to income328 238 175 157 108 Asset impairments 621 7,379 9,684 665 24 Gain on sale of assets and equity investments(1,175) (2,505) (101) (202) (598) Changes in operating assets and liabilities.
10 (Increase) decrease in receivables(747) 1,413 1,431 (1,091) 242 (Increase) decrease in inventories79 (112) (24) 17 (104) Decrease in other current assets58 89 33 65 71 Increase (decrease) in accounts payable and accrued liabilities265 (530) (1,989) 603 (559) Increase (decrease) in current domestic and foreign income taxes369 (54) (331) 17 40 Other operating, net382 - (650) (461) 722 Operating cash flow from continuing operations10,229 8,871 3,254 2,519 3,575 Operating cash flow from discontinued OPERATIONS , net of taxes2,549 2,197 97 864 - Net cash provided by operating activities12,778 11,068 3,351 3,383 3,575 CASH FLOW FROM INVESTING ACTIVITIESC apital expenditures(7,357) (8,930) (5,272) (2,717) (2,439) Change in capital accrual149 542 (592) (114) 20 Payments for purchases of assets and businesses(606) (1,687) (109) (2,044) (1,060) Sale of assets and equity investments, net1,619 4,177 819 302 1,293 Other, net(122) (346) (269)