Transcription of Reverse Osmosis Optimization - Energy
1 Reverse Osmosis Optimization Prepared for the Department of Energy Federal Energy Management Program By Pacific Northwest National Laboratory K. L McMordie Stoughton, X. Duan, and Wendel August 2013 Contacts Will Lintner, ., CEM Federal Energy Management Program Department of Energy 1000 Independence Ave. SW Washington, DC 20585-0121 Phone: (202) 586-3120 E-mail: Kate McMordie Stoughton Pacific Northwest National Laboratory Box 999 Richland, WA Phone: (888) 375-7665 E-mail: Cover photo: Reverse Osmosis system at Sandia National Laboratories. i Acknowledgements The authors of this report would like to thank the following individuals that provided support to the production of the technology evaluation. Federal Energy Management Program: Will Lintner Pacific Northwest National Laboratory: Shannon Colson Brian Boyd James Cabe Jennifer Williamson Matt Wilburn Massine Merzouk Susan Sande Rose Zanders Tobyhanna Army Depot: Charles Valenza Tom Wildoner ii Abbreviations and Acronyms CA FEMP cellulose acetate Federal Energy Management Program gpm gallon per minute HERO High Efficiency Reverse Osmosis MESA Microsystems and Engineering Sciences Applications Mgal million gallons psi pounds per square inch RO Reverse Osmosis TDS total dissolved solids TFC thin film composite TSS total suspended solids iii Contents Executive Summary.
2 Vi 1 Introduction to Reverse Osmosis .. 1 RO System Components ..2 RO Membrane Introduction ..3 System Recovery Rate ..4 2 Strategies to Increase Recovery Rate .. 6 Feed Water Advanced Membrane Technology ..8 Flow Configuration Optimization ..9 3 Federal Examples of Optimized RO Systems .. 12 Tobyhanna Army Depot RO System Optimization ..12 Sandia National Laboratories High Efficiency Reverse Osmosis 4 System Implementation Considerations .. 16 Membrane Selection ..16 Pretreatment Considerations ..16 RO Process Configuration ..17 System Commissioning ..18 Financial Considerations ..19 iv List of Figures Figure 1. Osmosis versus Reverse Osmosis .. 1 Figure 2. Diagram of an RO System with Basic Components .. 2 Figure 3. Spiral Wound Membrane Configuration .. 4 Figure 4. Hollow Fiber Membrane Configuration.
3 4 Figure 5. Pretreatment Process .. 7 Figure 6. Single-Stage RO Flow Unit with Concentrate Recirculation .. 10 Figure 7. Two-Stage RO System .. 10 Figure 8. Partial Two-Pass RO System .. 11 Figure 9. Tobyhanna Army Deport Two-Pass RO System .. 12 Figure 10. Tobyhanna Army Depot RO System Optimization .. 14 Figure 11. Sandia National Laboratories HERO System Configuration .. 15 List of Tables Table 1. Membrane Properties .. 3 Table 2. Water Classification of Total Dissolved Solids .. 6 Table 3. Pretreatment Options and Impacts .. 17 v Executive Summary This technology evaluation was prepared by Pacific Northwest National Laboratory on behalf of the Department of Energy s Federal Energy Management Program (FEMP). The technology evaluation assesses techniques for optimizing Reverse Osmosis (RO) systems to increase RO system performance and water efficiency.
4 This evaluation provides a general description of RO systems, the influence of RO systems on water use, and key areas where RO systems can be optimized to reduce water and Energy consumption. The evaluation is intended to help facility managers at Federal sites understand the basic concepts of the RO process and system Optimization options, enabling them to make informed decisions during the system design process for either new projects or recommissioning of existing equipment. This evaluation is focused on commercial-sized RO systems generally treating more than 80 gallons per hour. RO technology provides high purity water by forcing water through a semi-permeable membrane that filters out dissolved solids and other impurities. RO technology is used in applications where high purity water is essential including boiler feed water filtering, product rinsing, microelectronics production, laboratory testing, biotechnology, and other processes that require highly purified water.
5 This technology evaluation explores three categories of RO system Optimization : 1. Feed water pretreatment: Dissolved and suspended solids can be filtered from water supplied to the RO membrane, which allows the membrane to operate more efficiently and enhances overall system performance. 2. Advanced and new membrane technologies: New membrane technology is commercially available that increases the membrane surface area and permeability to increase system performance, reducing both Energy and water use. 3. Flow configuration: RO systems can be designed optimally to recirculate water through the system, reducing the amount of water supplied to the system. There are several savings opportunities that can be achieved through optimizing RO systems including reduction in Energy and water consumption and membrane maintenance and replacement costs.
6 Wastewater treatment costs also may be reduced if there is a reduction in discharge to drain. RO systems are Energy intensive. But by optimizing the RO performance, the system can potentially have a lower operating pressure, resulting in less Energy consumed. optimizing RO systems also results in an increased water recovery rate, equating to a reduction in the total amount of feed water entering the system. Another savings opportunity is membrane maintenance and replacement. Pretreatment Optimization plays a key role in keeping the membrane clean and efficient, which reduces the frequency of membrane cleaning and extends the life of the membrane elements. Because of the site specific nature of large RO systems, there is not a typical range of potential Energy , water, and cost savings from system Optimization . A detailed analysis for the particular installation will be required to estimate savings associate with system improvements.
7 Vi The evaluation includes two examples of optimized RO systems at Federal sites: Tobyhanna Army Depot recommissioned a large RO system to improve the system performance, which included feed water pretreatment, system configuration Optimization , and pressure balancing. These improvements resulted in: o Increased production rate of the system to 150% of design o System recovery rate of 90% o Drop in system pressure requirements that doubled the flow rate through the system, reducing Energy use o Extension of the RO membrane life o Decreased operation cost by over $90,000 annually Sandia National Laboratories upgraded an existing RO system with a High Efficiency Reverse Osmosis (HEROTM) unit that provides highly purified rinsing water to a microelectronics processing complex. The HERO system provides specially designed pretreatment to the water before it enters the RO system, which increased the system recovery rate from 60% to 95%, saving 34 million gallons annually.
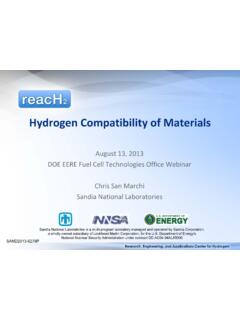
8 Vii 1 Introduction to Reverse Osmosis Reverse Osmosis (RO) technology is used in the water purification process to filter out dissolved solids and other large molecules. Typical applications of RO technology are seawater desalination, boiler feed water filtering, product rinsing, microelectronics production, laboratory testing, biotechnology, and other process that require highly purified water. There are RO systems on the market treating as little as 25 gallons per hour to more than 450,000 gallons per day. Reverse Osmosis is what the name implies: Osmosis in Reverse . In Osmosis , water with a lower concentration of solids naturally flows through a membrane to an area of higher concentration through naturally occurring osmotic pressure, equalizing the concentration of the solute on either side of the membrane. The RO technology applies pressure to a stream of water to overcome the natural osmotic pressure.
9 The feed water is forced through a semi-permeable membrane, emerging as purified water and leaving behind a concentrated solution of dissolved solids (see Figure 1). Terminology: The following list provides definitions of basic terms used throughout the technology evaluation: Feed water: Supply water that is fed into the RO system to be treated Permeate: A portion of the feed water that passes through a series of membranes and is returned as purified water Concentrate: A portion of the feed water that is rejected by the membrane and contains the solution of impurities that have been filtered out of the permeate Water flux: The rate of permeate production typically expressed as the rate of water flow per unit area of membrane ( , gallons per square foot per day) Recovery rate: The ratio of permeate flow to feed water flow, which indicates the overall water efficiency of the system Figure 1.
10 Osmosis versus Reverse Osmosis 1 RO System Components RO systems consist of the following basic components, which are common to every RO system. The specifications for each component vary by application, source water quality, and the required permeate quality. 1. Pre-filter(s): It is common for pre-filters to pretreat the feed water supply before it enters an RO system. Multiple pre-filters may be used in an RO system. The most commonly used pre-filters are sediment filters used to remove sand, silt, dirt, and other sediment. Carbon filters also may be used to remove chlorine and organic compounds. (More information on pretreatment is provided in Section ) 2. Reverse Osmosis membrane: The RO membrane is the heart of the system. The membrane is where the contaminants are trapped in the concentrate and purified water is produced.