Transcription of Review of AASHTO Green Book Procedures for Sight …
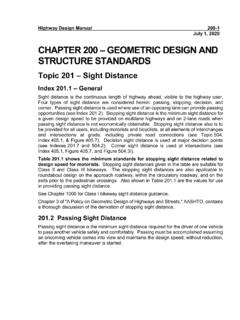
1 190 TRANSPORTATION RESEARCH RECORD 1280 Review of AASHTO Green book Procedures for Sight Distance at Ramp Terminals KAY FITZPATRICK AND JOHN M. MASON, JR. Policy described in the AASHTO Green book (1984 edition) concerning Sight distance at ramp terminals is reviewed. Ramp terminal design Procedures should be commensurate with design principles for at-grade intersections and required si~ht dista~ce values should be similar to those for stop-controlled mtersect10n Sight distance values. However, Sight distance values for ramp terminals are over 21 percent lower than those obtained from the B-1 curve procedure because of different distance-traversed assumptions. Available Sight distance has been recalculated. at ramp terminals assuming the Green book values for stoppmg Sight distance, driver eye height, and object height. Equations were developed to reproduce the B-1 curve and then truck char-acteristics were substituted for passenger car characteristics to determine the Sight distance requirements for a stopped truck.
2 K values needed to produce vertical curves that will provide the required Sight distances ( , B-1 curve Sight distances) both for passenger cars and for trucks are generally greater than Green book K values used for vertical curve design. Therefore, devel-opment of alternative approaches for establishing Sight distance values at ramp terminals (and at-grade intersections) should be investigated. AASHTO 's 1984 A Policy on Geometric Design of Highway and Streets ( Green book ) (1) contains several Procedures that can be used to determine intersection Sight distance for a stopped vehicle. One procedure (Case III) is described for stop controls on secondary roads. The Green book (1) states that "the driver of the vehicle on the minor road must have sufficient Sight distance for a safe departure from the stopped position even though the approaching vehicle comes in view as the stopped vehicle begins its departure movements." Other Procedures are described for arterial highways, railroad-grade crossings, and ramp terminals.
3 In the ramp terminal section, the Green book (1) states that "although ramp terminals may be considered part of interchange design .. the terminals should be planned in accordance with design principles for at-grade intersections ;ind with p;irticul;ir ;ittention to Sight ctist;ince ch;irncteristics." As such, the ramp terminal procedure should produce results that are similar to Case III Procedures . But Sight distance values presented in Table 1 for ramp terminals are different from those found using Case III Procedures (shown in Figure 1). If the ramp terminal procedure is only concerned with K. Fitzpatrick, Texas Transportation Institute, Texas A&M Univer-sity, College Station, Texas 77843. J. M~son: Pennsylvama Tra~s portation Institute, Pennsylvama State Umvers1ty, Research Bmldmg B, University Park, Pa. 16802. Sight distance to the left for a left-turning vehicle, then the ramp terminal procedure should yield results similar to those produced using the B-1 curve procedure (see Figure 1).
4 How-ever, the ramp terminal Sight distance values are over 21 percent lower than the B-1 curve values. When the ramp terminal Sight distance values are compared with the values obtained using other Procedures ( , turning vehicle attains average running speed or design speed), the differences are much greater. Using the values in Table 1 at a ramp terminal will result in Sight distances that are less than the Sight dis-tances at other at-grade intersections that use Case III Procedures . Parameters are identified that are necessary to calculate both the Sight distances at ramp terminals and the relevant Case III curve. An evaluation of the parameters explains the differences in the Sight distance values betwen the ramp ter-minal and Case III, B-1 curve Procedures . Development of specific equations permits the calculation of Sight distances for other conditions, such as when the stopped vehicle is a truck, or when a vehicle turning onto a road must clear more than one lane.
5 Green book (J) POLICY Sight distance criteria for ramp terminals are intended to ensure that a vehicle stopped at the terminal will have adequate time to turn left and clear the intersection without colliding with a vehicle coming from the left. Ramp terminals should be designed on the basis of the same Sight distance design ele-ments as those used for other at-grade intersections. An added Sight distance consideration is the location of bridge parapet walls or bridge railings. The Green book (1) indicates that the primary difference between this condition and the Case III-A (crossing maneu-ver) procedure is the increase in the time and distance traveled by vehicles negotiating the left turn rather than 1,;russiug the highway. Distances cited in the Green book (1) for a turning vehicle to clear the intersection are 60 ft for the passenger car, 90 ft for the SU design vehicle, and 120 ft for the WB-50 design vehicle. Other assumptions include Front of the stopped vehicle is 10 ft from the edge of the through pavement ( , D = 10 ft); Turning vehicle follows its minimum turning path; Turning vehicle enters a two-lane, two-way roadway; Fitzpatrick and Mason TABLE 1 REQUIRED Sight DISTANCE ALONG THE CROSSROAD AT TERMINALS OF RAMPS AT INTERCHANGES [ Green book (1), TABLE IX-9] Sight Distance Required to Sight Distance Permit Design Vehicle to Available to Turn Left from Ramp to Entering Vehicle Crossroad When Vertical Curve on Crossroad is Assumed Designed for Design Design Vehicle Assumed at Stopping Sight Speed on Ramp Terminal Distanceb Major road p SU WB-50 p SU or WB-50 (mi(h) (ft) (ft) (ft) (ft) (ft) 30 320 460 620 310 350 40 420 610 820 420 480 50 530 760 1,030 540 600 60 630 910 1, 230 730 820 70 740 1, 060 1,430 920 1,040 Sight distance measured from height of eye of 3.)
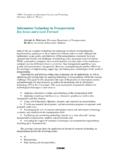
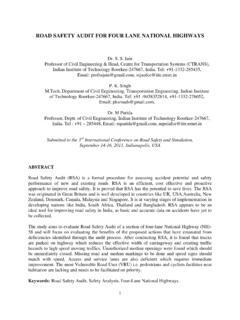
6 50 ft for P, SU, and WB-50 design vehicle to an object ft high. ~inimum available stopping Sight distance based on the assumption that there is no horizontal Sight obstruction and that S<L. Time to accelerate can be determined from Figure 2; and Perception and preparation time is sec. Figure 3 shows the Sight distance at ramp terminals. The Green book (J) criteria indicate that both the horizontal Sight triangle (Figure 3a) and the vertical curvature (Figure 3b) should be checked to ensure that the required critical Sight distance from Table 1 is provided. Further, the privileged vehicle (traveling unimpeded) must have adequate stopping Sight distance to a vehicle stopped at the ramp terminal. 70 ~ "/ 11 v / 85 eo 55 % .. :I 50 -Q w w .. 45 "' z 0 di 40 w Q 35 ~~~ I I / ~ Q !; I v ~ / ~1ll1 ,, c. v .,:;:.--0 -I IJ. / -(I-~ ~ ~ .. ~ Vi ~ I "''OYV v ~ q,i"/ o .. L;11 I / ./ I / / .~I ~ -~ / ,/,/ / A f / v I '~ ~ ~I t v 30 25 J I ff J, I I 1 I I' 20 v 191 18 /.)
7 , Q 14 z 0 " w .., 12 w ::I ~ 10 z 0 ~ < a: 8 w .. w " " 8 < ~-4 ~ / "' / ,,. ~ / / ~~o.,, ~/ ~ ,,,.,.. ,, / ,.,I , ~v ~.,.,,. " / .~ / .< 'f!: ~,~ -~ "'~ .A ~/ , ~; -~~-;, 'I-~ .. ~ .. ~ ..-::; ,.., '"to,~i:-"' -".:.f-? "'_,..:~ / ~~V,1 / ~ __.,, ,..-~ ~~ ~c."1 ~I .. ~\.~..-~$ .. /. "'o<?< , ~ .r "''' ~0 ~~~~~~ /~~ ~---40 80 80 100 120 140 180 180 200 S =DISTANCE TRAVELED DURING ACCELERATION -FEET FIGURE 2 Sight distance at intersections [Case III, acceleration from stop, Green book (I), Figure IX-21). REPRODUCTION OF Green book (1) Sight DISTANCE VALUES Vehicle Acceleration From a Stopped Position A major influence on Sight distance is the acceleration capa-bility of the vehicle. Two figures in the Green book (J) can be consulted for vehicle acceleration information. Figure 2 shows time-distance curves depicting passenger car normal acceleration and the recommended assumed acceleration for v v [..-' I'" A -SAFE Sight DISTANCE FOR P VEHICLE CROSSING 2-LANE HIGHWAY FROM STOP.]]
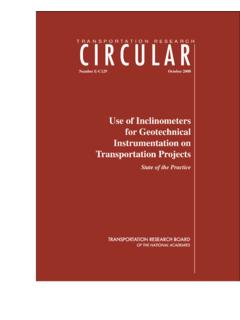
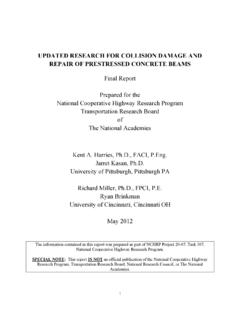
8 (SEE DIAGRAM) ,..v B-1 -SAFE Sight DISTANCE FOR VEHICLE TURNING LEFT INTO 2 LANE HIGHWAY ACCROSS P VEHICLE APPROACHING FROM LEFT. (SEE DIAGRAM) B-2& -SAFE Sight DISTANCE FOR P VEHICLE TO TURN LEFT INTO 2-LANE HIGHWAY AND ATTAIN DESIGN SPEED WITHOUT BEING OVERTAKEN llY A VEHICLE APPROACHING FROM THE RIGHT ANO MAINTAINING DESIGN SPEED B-2b-SAFE Sight DllTANOE FOR P VEHICLE TO TUR!4 LEFT INTO 2-LANE HIGHWAY AND A1 TAIN AVERAGE RUNNING SPEED WITHOUT BEING OVERTAKEN SY VEHICLE APPROACHING FROM THE RIGHT REDUCING SPEED FROM OE81GN SPEED TO AVERAGE RUNNING SPEED. (IEE DIAGRAM) Ca -SAFE Sight DISTANCE TO P VEHICLE TO TURN RIGHT INTO A 2-LANE HIGHWAY AND ATTAIN DESIGN SPEED WITHOUT BEING OVERTAKEN BY A P VEHICLE APPROACHING FROM THE LEFT TRAVELING AT DESIGN SPEED. Cb -SAFE Sight DISTANCE FOR P VEHICLE TO TURN RIGHT INTO 2-LANE HIGHWAY AND ATTAIN AVERAGE RUNNING SPEED WITHOUT BEING OVERTAKEN BY VEHICLE APPROACHING FROM THE LEFT ANO REDUCING FROM DESIGN SPEED TO AVERAGE RUNNING SPEED.
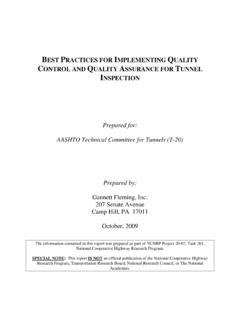
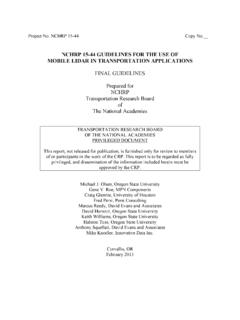
9 0 200 400 800 800 1000 1200 1400 1800 1800 2000 2200 2400 2800 BIGHT DISTANCE (FEET) FIGURE 1 Intersection Sight distance at at-grade intersections [Case III, B and C, Green book (1), Figure IX-27]. 192 --------it. 26" A Height ol Eye 3 50' ' ~ 141'--I --~-,-~r B FIGURE 3 Measurement of intersection Sight distance at ramp terminals [ Green book (1), Figure IX-29]. :z: II. :E I a w :z: () c w a: a w w II. CD 70 80 60 .. :.--"~ i--~ t:: .:::i:::;i;;.-~"--"~1-1-+-+-t--+-+-+-1 ~ ::;!. '~o , 40 k.~""' i::, 1--\ll\1\"\. "-'--t--t,--1--11-11-+-+-t--+-+-t-t-1 30 v vk::v 1 1 l'.;~A ACCELERATION OF 1_,_ L11 ~ PASSENGER CARS 20 I NORMAL RATE FOR 1-1-u,1~-1-+-~-+-+-+-+-+-l-I-LEVEL CONDITIONS --10 0 400 800 1200 1900 2000 2400 PASSENGER CARS -DISTANCE TRAVELED -FEET 80 60 :z: 60 II. :E I a w :z: () c w a: a w w II. CD 40 30 20 10 0 0 ACCELERATION OF I TRUCKS NORMAL RATE FOR LEVEL CONDITIONS REPRESENTATIVE WEIGHT/POWER RATIO 1000 2000 3000 4000 TRUCKS -DISTANCE TRAVELED -FEET FIGURE 4 Acceleration curves [ Green book (1), Figure IX-22].
10 6000 passenger cars, SU trucks, and WB-50 trucks. These curves represent 40-to 200-ft distances traveled during acceleration. Figure 4 presents speed versus distance curves for passenger car normal-rate acceleration for level conditions from 0 to 2,400 ft and "normal rate for level conditions, representative weight-power ratio" truck acceleration from 0 to 5,000 ft. Truck acceleration curves in Figure 4 represent SU and WB-50 design vehicles and were determined from truck performance studies. TRANSPORTATION RESEARCH RECORD 1280 Acceleration times can be estimated on the basis of Figure 4. Table 2 presents the distance values read from the figure in 5-mph increments. The distance increment column is the distance traveled during the previous 5-mph increase. The time increment column was calculated using the following equation: Time Increment 2 x Di tancc Increment (1) V 1,,1111o1 + V ""' where Vinitial and vfinal are the vehicle's initial and final speeds, respectively.