Transcription of Risk Assessment Table - CERT-LA
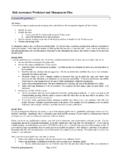
1 Risk Assessment (1)Asset or Operation at Risk(2)Hazard(3)Scenario(Location, Timing, Magnitude)(4)Opportunities for Prevention or Mitigation(5)Probability(L, M, H)Impacts with Existing Mitigation (L, M, H)(11)OverallHazard Rating(6)People(7)Property(8)Operations( 9)Environment(10)EntityInstructions on next Assessment 1: Compile a list of assets (people, facilities, machinery, equipment, raw materials, finished goods, information technology, etc.) in the left column. Column 2: For each asset, list hazards (review the Risk Assessment page from Ready business ) that could cause an impact.
2 Since multiple hazards could impact each asset, you will probably need more than one row for each asset. You can group assets together as necessary to reduce the total number of rows, but use a separate row to assess those assets that are highly valued or critical. Column 3: For each hazard consider both high probability/low impact scenarios and low probability/high impact scenarios. Column 4: As you assess potential impacts, identify any vulnerabilities or weaknesses in the asset that would make it susceptible to loss. These vulnerabilities are opportunities for hazard prevention or risk mitigation.
3 Record opportunities for prevention and mitigation in column 5: Estimate the probability that the scenarios will occur on a scale of L for low, M for medium and H for high. Columns 6-10: Analyze the potential impact of the hazard scenario in columns 6 - 10. Rate impacts L for low, M for medium and H for high. Column 8: Information from the business impact analysis should be used to rate the impact on Operations. Column 10: The entity column is used to estimate potential financial, regulatory, contractual, and brand/image/reputation impacts. Column 11: The Overall Hazard Rating is a two-letter combination of the rating for probability of occurrence (column 5) and the highest rating in columns 6 10 (impacts on people, property, operations, environment, and entity).
4 Carefully review scenarios with potential impacts rated as moderate or high. Consider whether action can be taken to prevent the scenario or to reduce the potential impacts.