Transcription of Risk Criteria, Protection Layers and Conditional …
1 Risk criteria , Protection Layers and Conditional modifiers Angela E. Summers, PE SIS-TECH Solutions, LP 12621 Featherwood Drive, Suite 120 Houston, TX 77034 281-922-8324 (phone), 281-922-4362 (fax) William H. Hearn, PE SIS-TECH Solutions, LP 12621 Featherwood Drive, Suite 120 Houston, TX 77034 281-922-8324 (phone), 281-922-4362 (fax) whearn@sis Keywords: Risk criteria , risk analysis, hazards, hazardous events Abstract Risk analysis assesses the likelihood and consequence of events. The acceptability of the identified risk is determined by comparing it to a specified risk tolerance.
2 The criteria applied depend on the analysis boundary, which may be loss of containment or extend to the harm posed by the loss of containment. Risk analyses generally begin with a determination of the likelihood that a hazardous event could result in loss of containment or some other undesirable consequence. These analyses require estimation of the likelihood that the initiating event will occur and the probability that the Protection Layers will not operate as required. Conditional modifiers are considered when the analysis is evaluating the likelihood that harm may be caused by the loss of containment.
3 Various methods for performing risk analyses are discussed in several CCPS publications including Chemical Process Quantitative Risk Analysis (1), Hazard Evaluation Procedures (4), and Layers of Protection Analysis (8). However, the link between the selected risk criteria as described in Guidelines for Developing Quantitative Safety Risk criteria (3) and the factors considered in the analysis is not clearly described in these texts. Recognizing this opportunity, this paper begins with a brief introduction to risk analysis concepts to provide a foundation for a discussion of the typical analysis boundaries and associated risk criteria .
4 Then, it discusses how the analysis boundary and risk criteria affect the consideration of Protection Layers , enabling conditions, and Conditional modifiers . 1. How is risk measured? Risk is the result of deviations from expected operation and is intimately related to the process design and site safety culture. Loss prevention seeks to identify these deviations and to reduce their frequency of occurrence or impact should they occur. The result of each deviation can be judged by analyzing the design and historical performance.
5 Some process deviations are significant enough that a hazardous event occurs. An effective process safety management program prevents deviations from propagating into hazardous events. The rigor of the management system determines whether the hazardous event risk is reduced as low as reasonably practicable. The level of a process risk is directly related to the frequency of process deviation and the consequence of exceeding the equipment safe operating limit. Process risk can be minimized using inherently safer principles in the design of the process to reduce the magnitude of the consequence and in the operational and management strategy to reduce the process deviation frequency (7).
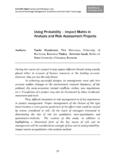
6 Varying levels of rigor are applied in estimating the risk from hazardous events (4). Generally, the specific method is chosen based on the following considerations: Regulatory requirements Company policy Lifecycle phase Information available Process complexity Previous experience with process Required degree of risk discrimination Consequence severity Risk ranking within the Process Hazards Analysis (PHA) has traditionally been qualitative, supported by a risk matrix that relates frequency and consequence to priority (Figure 1).
7 The risk rank is used to determine the priority and criticality of recommendations made to reduce risk and to address safeguard deficiencies. The event likelihood (Figure 1) is estimated given the listed causes and identified safeguards that prevent the deviation from exceeding the safe operating limit or reduce the hazardous situation that leads to harm. The frequency estimate is complex, because it requires that team members estimate the likelihood of simultaneous failure of many systems that rely on manual and automated actions.
8 Significant consequence events often have multiple safeguards with varying degrees of independence, diversity and capability. The difficulty for the team in performing the estimate is that hopefully the hazardous event has never happened and given the number of things that must go wrong seems unlikely to ever happen. Process upset, shutdown, near miss, and incident investigation reports can be used to better understand the likelihood of various aspects of the event, such as cause likelihood or safeguard failure (5).
9 Figure 1: Example PHA Risk Matrix For Ranking Hazardous Event Risk The team qualitatively ranks the consequence severity (Figure 1) by considering the hazardous situation posed by the event. The consequence severity ranking must not consider the action of safeguards; it should be ranked based on the harm that results when everything that could go wrong, has gone wrong. The inherent difficulty is that team experience and incident records include the operation of safeguards that can reduce the harm caused by hazardous situation, such as fire and gas systems or emergency response procedures.
10 Since consequence severity is often used to screen events for further analysis, it is important that the documentation reflect the hazardous situation without consideration of any safeguards including proactive, reactive, and emergency response activities. Consequence modeling can be used to better understand the hazardous situation and impact zone (2,10). The next level of risk analysis rigor estimates the event likelihood using a semi-quantitative technique (8) called Layers of Protection Analysis (LOPA).