Transcription of Risk Ranking and Risk Prioritization Tools
1 Risk Ranking and Risk Prioritization Tools Workshop on Produce Safety in Schools Sherri B. Dennis, FDA/CFSAN/OFDCER/RACT. October 28, 2009. Managing Food Safety Risk We have a full table Trying to do everything means that nothing gets done well Have to make decisions on where we will focus our efforts Risk Ranking : Terminology Also referred to as: Hazard Ranking Risk attribution Comparative risk assessment Applied to identify the most significant public health risks for a given situation Used in other fields engineering, insurance, transportation and environmental sciences Risk Prioritization Risk Prioritization goes beyond risk Ranking in that it compares scenarios (combinations of specific commodities, hazards, and control measures) using multiple criteria, and not just the public health risk Some of these additional criteria may include: cost of interventions or control measures feasibility of implementing control measures practicality of control measures effectiveness of control measures level of public concern level of certainty in the estimates political will Risk Analysis Comprised of three components: Risk management Risk assessment Risk communication What Triggers Risk management ?
2 Four broad types Crisis: real or perceived public outcry; media coverage; outbreak Science/technology: new knowledge uncovers a public health hazard of previously unknown risk Emerging or on the horizon : environmental events affecting products Strategic: needs identified through systematic planning Examples of Risk management Decisions Conduct additional research Encourage industry Detention of imported innovation product New legal theory Develop action plan New policy Do nothing (it's a decision!) New technologies Education and outreach Performance standard Enforcement action, industry Policy or regulation recall Remove from the market Guidance Seizure Preventative control Set and enforce tolerance program HACCP levels If safe approve; if not safe- Untitled and Warning letter -disapprove Risk Assessment: The Basics Risk assessment is . a systematic tool to better understand the complex interaction of hazards, food and human hosts one of the most objective and scientific ways to analyze the complexities of our food supply system focus our food safety efforts determine the relative effectiveness of prevention and control practices an approach to integrate science with state-of- the-art information technology to help manage food safety risks Risk Assessment: The Basics A process to describe what we know and how certain we are of what we know Answers 4 key questions: What can go wrong?
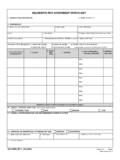
3 How likely is it to occur? What are the consequences? What factors can influence it? Four Examples . Qualitative Semi-quantitative (2). Quantitative Example: Qualitative 2007 CFSAN Domestic Priorities List The purpose of the 2007. priority' list is to target field resources toward higher public health risk problems 2007 CFSAN Domestic Priorities List: Features Ranked food/hazard pairs into 3. qualitative bins higher, moderate, lower risk Based on 2 criteria: Likelihood of an adverse event from consumption Severity of hazard Data and Information Collection The worksheet was designed to: Be flexible and easy to use Provide a transparent decision-making process Consider both data and expert opinion Likelihood (How many people get ill). Factors considered: The epidemiological link between the hazard and health effect due to consumption/use of the product ( , outbreaks). Frequency and level of the hazard associated with specific product ( , surveys, recalls).
4 Frequency of consumption or use of product and amount Effect of production, processing, handling in terms of how they influence the hazard in the product at the point of consumption/use ( , lethality step in processing). Severity (How ill do people get?). Factors considered: Typical outcome ( , diarrhea; death). Duration of illness Long-term problems after initial illness ( , chronic sequelae)? Is the entire population susceptible or a specific at-risk subpopulation ( , infants, elderly)? Relative Risk Ranking Likelihood Unlikely Likely Very likely (no illnesses) (some (many illnesses) illnesses). Severity Moderate lower lower medium (mild). Serious lower medium higher (incapacitating). Severe medium higher higher (life- threatening). Example: Semi-quantitative Produce Risk Ranking Tool Produce RR Tool: Purpose Transparent and systematic method Compare different commodity/. pathogen combinations to determine which present the most significant risks and prioritize them as candidates for interventions Identify higher-risk combinations for subsequent quantitative microbial risk assessment efforts Produce RR Tool: Features Characterize risk by: 9 criteria (grouped into 4 dimensions).
5 4 bins (scores). 5 weights Identify commodity/ hazard combinations based on outbreak data 11 commodity categories 3 hazard categories Total 51 commodity/ hazard pairs evaluated Dimensions & Criteria Strength of Epidemiological Association Epidemiological link Disease multiplier Severity of Disease Hospitalization rate Death Rate Pathogen Characteristics that Affect Disease Population susceptibility Infectious dose Commodity Characteristics Prevalence of contamination Consumption Growth potential/ shelf life Example Scoring: Epi Link Score Category No. of Total Outbreaks Cases 1 Weak any 100. 2 Moderate 1-2 > 100. 3 Strong 3-5 > 100. 4 Very >5 > 100. strong Produce RR Tool: Results Top 14 Commodities & Pathogen (Score). Leafy greens & E coli 0157:H7 (70). Tomatoes & Salmonella enterica (61). Leafy greens & Salmonella enterica (59). Melons & Salmonella enterica (59). Mixed produce & E coli 0157:H7 (59).
6 Crucifers & E coli 0157:H7 (56). Melons & E coli 0157:H7 (56). Mixed produce & Salmonella enterica (52). Herbs & E coli 0157:H7 (50). Green onions & Cryptosporidium parvum (50). Carrots & Salmonella enterica (50). Non-citrus fruit & Salmonella enterica (50). Leafy greens & Norovirus (50). Tomatoes & Norovirus (50). Example: Semi-quantitative iRISK: A web-based comparative risk assessment tool iRisk An On-Line Tool for Comparing Food Safety risks Assess public health impacts for chemicals and pathogens Compare food risks at any stage, throughout the food supply system Allows the sharing of data and models Current version in beta testing . public availability planned iRisk: Output An example of the first part of the output for a single simple scenario Example: Quantitative 2003 FDA/FSIS Listeria monocytogenes in Ready-to-Eat Foods 2003 FDA/FSIS Listeria monocytogenes in Ready-to-Eat Foods Risk Assessment The problem: Which foods should receive the most regulatory attention in order to improve public health?
7 2003 LM RTE RA: Features Compares risk of listeriosis from 23. categories of ready-to-eat foods , seafood, cheese, produce, meat, salads Compares risk for 2 matrices Risk per serving (individual risk). Risk per annum (population risk). Compares risk for different populations Three at-risk subpopulations The total population Components of Risk Assessment Hazard Identification Describes bacteria/ host /food characteristics that impact the risk Exposure Assessment Hazard Characterization How often is the bacteria ingested? For a given ingested dose, How many bacteria are then ingested? how likely is the adverse effect? Risk Characterization What is the probability of occurrence of the adverse effect? Total Cases Listeriosis per Annum (log scale). DM. PM. HFD. FNR. SUC. P. UM. CR. SS. F. FR. V. DFS. FSC. SSC. SRC. Deli meat DS. Risk per Annum RS. PF. IC. PC. Milk CD. HC. Pasteurized Total Cases Listeriosis per Serving (log scale -16.)
8 -15. -14. -13. -12. -11. -10. -9. -8. -7. -6. Assessment: Results DM. FNR. P. UM. SS. CR. HFD. 2003 Listeria RTE Foods Risk SUC. PM. FSC. FR. PF. RS. F. DFS. SSC. Risk per Serving SRC. V. DS. IC. PC. CD. HC. Results: Risk Categories Decreased Risk Per Annum A and B C and D E. Very High Risk High Risk Moderate Risk Deli Meats P t and Meat Spreads No food categories Frankfurters (not reheated) Unpasteurized Fluid Milk 1. Smoked Seafood Decreased Risk Per Serving High Risk Moderate Risk Moderate Risk High Fat and Other Dairy Cooked RTE Crustaceans No food categories Products 2. Pasteurized Fluid Milk Soft Unripened Cheese Moderate Risk Moderate Risk Low Risk No food categories Deli Salads Preserved Fish Dry/Semi-dry Fermented Sausages Raw Seafood Frankfurters (reheated) 3. Fresh Soft Cheese Fruits Semi-soft Cheese Soft Ripened Cheese Vegetables Moderate Risk Low Risk Very Low Risk No food categories No food categories Cultured Milk Products 4.
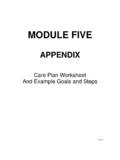
9 Hard Cheese Ice Cream and Frozen Dairy Products Processed Cheese Conclusion Steps in risk assessment/ risk management : Clearly define the food safety problem to be addressed Decide approach and key assumptions Develop criteria (for risk Ranking ). Conduct assessment; validate and verify results Provide assessment results to decision-makers Decision-makers consider options; make decisions and implement Important: periodically review, evaluate & modify decisions, if needed Questions or Comments? Man's mind, once stretched by a new idea, never regains its original dimensions. ~Oliver Wendell Holmes