Transcription of Risk Reporting & Key Risk Indicators - ERM Initiative | ERM
1 Risk Reporting &. Key Risk Indicators A Case Study Analysis Stephen R. Boyd | Johannes A. Moolman | Nkemjika J. Nwosu Table of Contents Introduction___ _____ 1. Case Illustration #1: Midwestern Utility Company, Inc. _____ 2. Case Illustration #2: Wimbledon Investments _____ 13. Case Illustration #3: Discovery Health Group _____ 23. Conclusion _____ 31. About the Authors _____ 32. Introduction The main purpose of this case study is to take a closer look at risk Reporting metrics and key risk Indicators (KRIs). KRIs are metrics used to provide an early signal of increasing risk exposure in various areas of the organization. This study is based on three different companies in different industries illustrating the overall Enterprise Risk Management (ERM) process and the role that risk Reporting and KRIs play in that process.
2 For each company, the study provides examples of how risk metrics can be developed, monitored, and reported. The main goal of the research is to provide examples that could be used as a guideline to help other organizations implement risk metrics and Indicators to effectively monitor major risks. In addition, this case study may also provide insights on the structure of the ERM. function and the operation of the ERM process at the three different companies. RISK Reporting & KEY RISK Indicators . 1. Case Illustration #1: Midwestern Utilities, Inc. OVERVIEW & COMPANY BACKGROUND. Midwestern Utilities, Inc., (The Company) is a utility holding company with approximately $20 billion in total assets, $5 billion in annual revenues, and a workforce of approximately 10,000 employees.
3 Its principal business operations are regulated electric and gas delivery businesses. The Company provides electric services to over 1 million customers in rural and urban areas and delivers gas services to over 100,000 customers in a few large metropolitan areas. The majority of the Company's business operations are subject to regulation. ERM PROCESS. The Company has always had a strong focus on risk management given the nature of its business and the fact that it faces extensive regulation. However, it had not taken a structured enterprise-wide approach to managing risks until it began a formal Enterprise Risk Management (ERM) program after the Sarbanes-Oxley Act of 2002 was passed. The CFO of the Company initiated the process by selecting a director of ERM.
4 The newly appointed director of ERM consulted two other utility companies that had more mature ERM processes to identify best practices that are important for a successful ERM launch. The ERM director began the ERM process by going to each of the senior vice presidents of the major departments of the Company to request participation in the development of the initial inventory of risks. Each senior vice president then selected one individual at the director or general manager level to represent them in the ERM function. After collecting all of the key people from each department, the ERM director organized a series of brainstorming workshops. Starting at the enterprise level and working down into the department level, the workshops focused on the major corporate risks.
5 The workshop started with the scenarios that would be the most severe if they were to occur. Next, the workshop determined which scenarios would have the greatest likelihood of occurring. Finally, the workshop determined which scenarios would be more controllable by the Company. When this process was completed, the ERM director had a list of 14 major corporate risks that were spread out among all of the departments in the Company. For each of these risks, a person within the responsible department was named the risk owner and was given the responsibility of managing the risk. The risk owners continued to work under the senior vice presidents in their departments while also working with the ERM director to manage the risks.
6 All of the risk owners collectively constitute the corporate risk committee, and each serve the ERM function in addition to the current position they hold in their respective departments. RISK Reporting & KEY RISK Indicators . 2. DEVELOPING KEY RISK Indicators . The Company began developing KRIs as the ERM function matured and became more integrated with the operations of the Company. The goal was to develop metrics that would provide signals to alert management to increasing risk exposures or trends that could either present opportunities or threaten the achievement of corporate goals. The Company relied on data driven analysis to support its conclusions throughout this process, and organized its thinking by using a technique referred to as a bowtie analysis to identify the metrics that would be most helpful in predicting risk events.
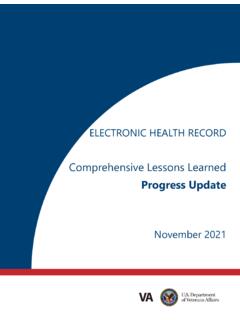
7 The bowtie analysis (see illustration below) starts with the risk at the knot of the tie, and then describes the events or circumstances that may cause the risk event to occur, paying particular attention to root causes . Once those causes have been identified, the analysis then identifies preventive measures that could be implemented. At this point there could be an evaluation of the actual preventive measures that the organization has in place to determine whether additional measures should be put in place. The analysis then moves to the right to look at the potential consequences that would result after the risk event happens, and the plans the organization either has or should have in place to minimize the negative effects of the risk.
8 causes Consequences . What would cause Risk What would the this event to Event consequences be if happen? this event occurs? What are we doing What plans do we have to prevent it? in place to minimize the damage? The root causes that have been identified in the box on the upper left of the bowtie analysis become the focus of the development of KRIs. With the goal being to identify metrics that track those root causes . At the Company, the bowtie analysis was completed through a series of workshops organized by the ERM director. Each workshop included the risk owner as well as subject matter experts from each RISK Reporting & KEY RISK Indicators . 3. department. These subject matter experts usually worked within the organization at the department level but also had experience dealing with issues affecting the Company at the enterprise level.
9 The ERM director included subject matter experts to help create a setting which encouraged debate, but limited the number of subject matter experts to between 6 and 8 in order to keep the discussion focused. The ERM director believed that with the right combination of people and the appropriate level of preparation he could create the kind of atmosphere that would drive the creativity needed to identify the relevant root causes of the major corporate risks of the organization. Each workshop would last two to four hours, and depending upon the complexity of the risk the number of workshops needed to vet each risk could range from two to four. The ERM director found that these workshops had to be broken down into a series of meetings in order to be more effective due to the exhaustive nature of the approach.
10 Each risk owner was asked to pull together information on their risk in advance of the meeting in order to optimize time in the workshop. Once the cause events are identified, subject matter experts help the group by providing relevant information for each cause event. With that information in hand, the group can look more closely at potential cause events and discuss differences of, all of which sharpens the group's focus. The risk owners worked together to decode the root causes of the identified risks by discussing what combination of events would lead to the occurrence of each risk. Then, they seek to understand the issues which cause the event to occur. This requires the involvement of subject matter experts who are well versed in the fields relating to each identified risk.