Transcription of Rob J. Hyndman
1 forecasting : principles & PracticeLeader: Rob J Hyndman23-25 September 2014 University of Western Introduction to Introduction .. Some case studies .. Time series data .. Some simple forecasting methods .. Lab Session 1 .. 132 The forecaster s Time series graphics .. Seasonal or cyclic? .. Autocorrelation .. Forecast residuals .. White noise .. Evaluating forecast accuracy .. Lab Session 2 .. 323 Exponential The state space perspective .. Simple exponential smoothing .. Trend methods .. Seasonal methods .. Lab Session 3 .. Taxonomy of exponential smoothing methods .. Innovations state space models .. ETS in R.
2 forecasting with ETS models .. Lab Session 4 .. 514 Time series Example: Euro electrical equipment .. Seasonal adjustment .. STL decomposition .. forecasting and decomposition .. Lab Session 5a .. 572 forecasting : principles and practice35 Time series Cross-validation .. Example: Pharmaceutical sales .. Lab Session 5b .. 626 Making time series Transformations .. Stationarity .. Ordinary differencing .. Seasonal differencing .. Unit root tests .. Backshift notation .. Lab Session 6 .. 717 Non-seasonal ARIMA Autoregressive models .. Moving average models .. ARIMA models .. Estimation and order selection.
3 ARIMA modelling in R .. forecasting .. Lab Session 7 .. 838 Seasonal ARIMA Common ARIMA models .. ACF and PACF of seasonal ARIMA models .. Example: European quarterly retail trade .. Example: Cortecosteroid drug sales .. ARIMA vs ETS .. Lab Session 8 .. 939 State space Simple structural models .. Linear Gaussian state space models .. Kalman filter .. ARIMA models in state space form .. Kalman smoothing .. Time varying parameter models .. Lab Session 9 .. 10410 Dynamic regression Regression with ARIMA errors .. Example: US personal consumption & income .. forecasting .. Stochastic and deterministic trends.
4 Periodic seasonality .. Dynamic regression models .. 113 forecasting : principles and Rational transfer function models .. Lab Session 10 .. 11511 Hierarchical Hierarchical and grouped time series .. forecasting framework .. Optimal forecasts .. OLS reconciled forecasts .. WLS reconciled forecasts .. Application: australian tourism .. Application: australian labour market .. hts package for R .. Lab Session 11 .. 12712 Vector autoregressions12813 Neural network models13114 forecasting complex TBATS model .. Lab Session 12 .. 1371 Introduction to IntroductionBrief bio Director of Monash University s Business & Economic ForecastingUnit Editor-in-Chief,International journal of ForecastingHow my forecasting methodology is used: Pharmaceutical Benefits Scheme Cancer incidence and mortality Electricity demand Ageing population Fertilizer salesPoll: How experienced are you in forecasting ?
5 : I wrote the book, done it for decades, now I do the Expert: It has been my full time job for more than a Skilled: I have been doing it for Comfortable: I understand it and have done Learner: I am still Beginner: I have heard of it and would like to learn Unknown: What is forecasting ? Is that what the weather people do?Key referenceHyndman, R. J. & Athanasopoulos, G. (2013) forecasting : principles and Free and online Data sets in associated R package R code for examples5 forecasting : principles and practice6 Poll: How proficient are you in using R?1. Guru: The R core team come to me for Expert: I have written several packages on Skilled: I use it regularly and it is an important part of my Comfortable: I use it often and am comfortable with the : I use it sometimes, but I am often searching around for theright Learner: I have used it a few Beginner: I ve managed to download and install Unknown: Why are you speaking like a pirate?
6 Install required ("fpp", dependencies=TRUE)Getting help with R# Search for (" forecasting ")# Detailed helphelp(forecast)# Worked examplesexample(" ")# Similar namesapropos("forecast")#Help on packagehelp(package="fpp")Approximate outlineDayTopicChapter1 The forecaster s toolbox1,21 Seasonality and trends61 Exponential smoothing72 Time series decomposition62 Time series cross-validation22 Transformations22 Stationarity and differencing82 ARIMA models83 State space models 3 Dynamic regression93 Hierarchical forecasting93 advanced methods9 forecasting : principles and practice7 Assumptions This is not an introduction to R. I assume you are broadly comfort-able with R code and the R environment. This is not a statistics course. I assume you are familiar with con-cepts such as the mean, standard deviation, quantiles, regression,normal distribution, etc.
7 This is not a theory course. I am not going to derive anything. I willteach you forecasting tools, when to use them and how to use themmost Some case studiesCASE STUDY 1: Paperware companyProblem:Want forecasts of each of hundreds of items. Series can be sta-tionary, trended or seasonal. They currently have a large forecasting pro-gram written in-house but it doesn t seem to produce sensible want me to tell them what is wrong and fix information Program written in COBOL making numerical calculations is not possible to do any optimisation. Their programmer has little experience in numerical computing. They employ no statisticians and want the program to produce fore-casts STUDY 1: Paperware companyMethods currently usedA 12 month averageC 6 month averageE straight line regression over last 12 monthsG straight line regression over last 6 monthsH average slope between last year s and this year s values.
8 (Equivalent to differencing at lag 12 and taking mean.)I Same as H except over 6 I couldn t understand the STUDY 2: PBSThePharmaceutical Benefits Scheme(PBS) is the australian governmentdrugs subsidy scheme. Many drugs bought from pharmacies are subsidised to allow moreequitable access to modern drugs. The cost to government is determined by the number and types ofdrugs purchased. Currently nearly 1% of GDP. The total cost is budgeted based on forecasts of drug usage. In 2001: $ billion budget, under-forecasted by $800 million. Thousands of products. Seasonal demand. Subject to covert marketing, volatile products, uncontrollable : principles and practice8 Although monthly data available for 10 years, data are aggregated toannual values, and only the first three years are used in estimatingthe forecasts.
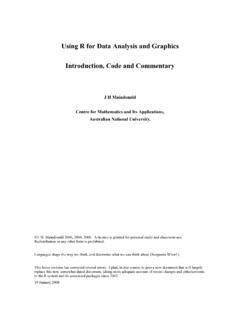
9 All forecasts being done with theFORECAST function in MS-Excel!Problem:How to do the forecasting better?CASE STUDY 3: AirlineFirst class passengers: Melbourne class passengers: Melbourne SydneyYear19881989199019911992199302468 Economy class passengers: Melbourne SydneyYear198819891990199119921993010203 0 Problem:how to forecast passenger traffic on major information They can provide a large amount of data on previous routes. Traffic is affected by school holidays, special events such as theGrand Prix, advertising campaigns, competition behaviour, etc. They have a highly capable team of people who are able to do mostof the Time series dataTime series consist of sequences of observations collected over time. Wewill assume the time periods are equally spaced.
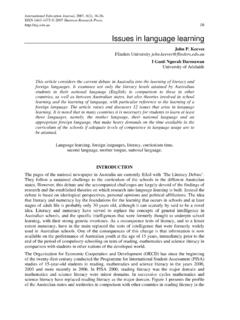
10 Daily IBM stock prices Monthly rainfall Annual Google profits Quarterly australian beer productionForecasting is estimating how the sequence of observations will con-tinue into the : principles and practice9 australian beer productionYearmegaliters1995200020052010 400450500 australian GDPausgdp <- ts(scan(" "),frequency=4, start=1971+2/4) Class: "ts" Print and plotting methods available.> ausgdpQtr1 Qtr2 Qtr3 Qtr41971 4612 46511972 4645 4615 4645 47221973 4780 4830 4887 49331974 4921 4875 4867 49051975 4938 4934 4942 49791976 5028 5079 5112 51271977 5130 5101 5072 50691978 5100 5166 5244 53121979 5349 5370 5388 53961980 5388 5403 5442 5482 forecasting : principles and practice10 Residential electricity salesTimeausgdp1975198019851990199545005 00055006000650070007500> plot(ausgdp)> elecsalesTime Series:Start = 1989 End = 2008 Frequency = 1[1] [7] [13] [19] package used in this course> library(fpp)This loads.