Transcription of ROC analysis for the evaluation of continuous biomarkers ...
1 Paper SP09-2009 ROC analysis for the evaluation of continuous biomarkers : existing tools and new features in SAS Sanghyuk Shin, Beckman Coulter, Inc., San Diego, CA ABSTRACT biomarkers have become essential tools for proper diagnosis and treatment of a wide range of illnesses, including cancer, diabetes, and infectious diseases. The growing need for rigorous evaluation of new biomarkers for medical practice has spurred the development and characterization of statistical methods for diagnostic accuracy. The receiver operating characteristic (ROC) curve is the standard analytical tool for evaluating diagnostic tests. However, recent studies suggest widespread use of inappropriate statistical methods for ROC analysis .
2 In addition, while enhancements in SAS have greatly simplified basic ROC analysis for SAS users, many common ROC techniques still require extensive additional programming for SAS users. This paper provides an overview of statistical methods for evaluating continuous biomarkers using ROC analysis . For each statistical technique, existing tools available in SAS for performing the task are described, with particular emphasis on methods not addressed in previous SAS papers. The paper also introduces new features for ROC analysis that are now available as a standard component of the LOGISTIC procedure in SAS Statistical techniques addressed in the paper include the comparison of the area under the ROC curve (AUC) of two or more biomarkers and the generation of confidence intervals for sensitivity given fixed specificity.
3 Pancreatic cancer data (Wieand et al. 1989) that have been widely used as sample data in statistical literature are used in this paper to illustrate the application of statistical concepts. KEYWORDS ROC, biomarkers , sensitivity, specificity, diagnostic, Proc Logistic INTRODUCTION Statistical methods for evaluating the diagnostic accuracy of biomarkers have received increased scrutiny in recent years. In fact, systematic reviews of published studies on diagnostic tests have revealed numerous methodological shortcomings (Lijmer et al., 1999; Obuchowsky et al., 2004). Use of appropriate statistical techniques is essential in accurately evaluating the performance and clinical utility of a biomarker. This paper discusses statistical techniques for evaluation of biomarkers and highlights methodological errors often found in medical literature.
4 While the application of the methods presented in the paper is on biomarkers , much of the content of the paper is applicable to any diagnostic test with a continuous outcome. A common study design for biomarker evaluation involves comparison of the performance of a newly developed biomarker to a standard biomarker in the same sample population. Therefore, this paper focuses on paired or correlated analyses. Additionally, non-parametric techniques are emphasized, as they are more widely applied in biomarker evaluation than parametric ROC analysis involving binormal assumptions. Previous SAS papers have described other useful ROC techniques, including ROC analysis for ordinal outcome data and regression analysis to adjust for covariates (Mandrekar and Mandrekar, 2005; G nen, 2006).
5 The primary goal of this paper is to describe methods that have not been addressed by previous papers and also to highlight new tools in SAS that simplify basic ROC analysis . SENSITIVITY AND SPECIFICITY The diagnostic accuracy of a biomarker is most commonly measured by calculating its sensitivity and specificity. Sensitivity is the proportion of patients who are correctly categorized as having disease among those who truly have the disease. Similarly, specificity is the proportion of patients who are correctly categorized as not having the disease among all patients who truly don t have the disease. Since most diagnostic biomarkers provide results in the continuous scale ( concentration of the CA19-9 tumor marker in serum measured in U/ml), the sensitivity and specificity of the test depends on the specific threshold selected.
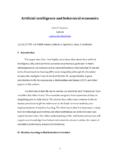
6 For example, for the CA19-9 biomarker in the sample data set (Wieand et al., 1989), a value of 37 U/ml has been postulated as the threshold for positive result for pancreatic cancer. Sensitivity and specificity can be calculated for this threshold by constructing a 2 x 2 table with the FREQ procedure: 1 PROC FORMAT; VALUE tholdfmt 0 - 37 = "<37 U/ml" 37 - high = "37+ U/ml"; VALUE pcafmt 0 = 'No Cancer' 1 = 'Cancer'; RUN; PROC FREQ DATA=panca ORDER=formatted; FORMAT y1 tholdfmt. d pcafmt.; LABEL y1='CA19-9' d='Pancreatic Cancer'; TABLES y1 * d / NOROW NOPERCENT; run; In the Pancreatic Cancer data set, d is a dichotomous variable for the patient s cancer status and y1 is a continuous variable of the biomarker CA19-9.
7 For the 2 x 2 analysis , y1 is dichotomized by designating it with the THOLDFMT format for the appropriate threshold. The code produces the following output: The percent values on the Cancer column are used to determine sensitivity and the percent values on the No Cancer column are used to derive specificity using the CA19-9 threshold of 37 U/ml. Among the 90 cancer patients, 68 tested positive, giving us a sensitivity of 76%. Likewise, 46 of the 51 non-cancer patients tested negative for a specificity of 90%. When a threshold is predefined as in the example above, confidence intervals for sensitivity and specificity can be calculated using standard statistical methods for binomial data. Again, PROC FREQ is a simple solution for this task.
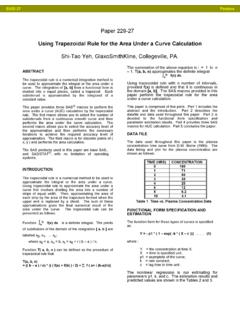
8 You will have to generate separate output for sensitivity and specificity by using the WHERE statement to select for cancer patients and non-cancer patients. The code below generates the 95% confidence intervals for sensitivity of the CA19-9 marker in the Pancreatic Cancer data set. PROC FREQ DATA=panca ORDER=formatted; FORMAT y1 tholdfmt. d pcafmt.; LABEL y1='CA19-9' d='Pancreatic Cancer'; TABLES y1 / BINOMIAL; EXACT BINOMIAL; WHERE d=1; run; SAS generates confidence intervals for the proportion in the first row of the output (in this instance, ). Therefore, you should make sure that the proportions are listed in the order that places sensitivity (or specificity) in the first row. The code above uses ORDER=formatted to instruct SAS to use formatted values for ordering.
9 Otherwise, the output would have generated confidence intervals for The BINOMIAL option in the TABLES statement along with the EXACT BINOMIAL statement instructs SAS to produce confidence intervals using the normal approximation of the binomial distribution (asymptotic standard error or ASE) and the exact binomial distribution. SAS is able to efficiently calculate exact confidence intervals, which is the preferred method. See output below. 2 One important note: the binomial method of calculating confidence intervals for sensitivity and specificity is only valid if the threshold is predefined. One common mistake in diagnostic medicine literature is the use of simple binomial methods when thresholds are not predefined (Obuchowsky et al.)
10 , 2004). Often, the relevant research question involves determining the sensitivity and its 95% confidence interval for a predefined specificity. In such instances, the corresponding threshold must be estimated and the sampling variability in estimating the threshold must be taken into account. The same principle holds for deriving specificity for a predefined sensitivity. Appropriate methods to address this problem are discussed below. ROC analysis USING THE LOGISTIC PROCEDURE IN SAS GENERATING THE ROC CURVE The empirical ROC curve is the plot of sensitivity on the vertical axis and 1-specificity on the horizontal axis for all possible thresholds in the study data set. It is often used to explore thresholds for the application of a new biomarker in clinical practice or to visually assess the overall performance of the biomarker.