Transcription of ROC (Receiver Operating Characteristic) Curve Analysis
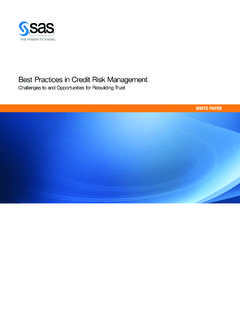
1 ROC ( receiver Operating Characteristic) Curve Analysis Julie Xu 17th November 2017. Agenda introduction Definition Accuracy Application Conclusion Reference 2017 All Rights Reserved | Confidential for INC Research/inVentiv Health use only 2. introduction ROC ( receiver Operating Characteristic) Curve is a fundamental tool for diagnostic test evaluation. It is increasingly used in many fields, such as data mining, financial credit scoring, weather forecasting etc. ROC Curve plots the true positive rate (sensitivity) of a test versus its false positive rate (1-specificity) for different cut-off points of a parameter ROC Curve is graphically to display the trade-off relationship between sensitivity and specificity for all possible thresholds SAS/STAT Procedures: FREQ, LOGISTIC, MIXED and NLMIXED can be used to perform ROC Curve Analysis 2017 All Rights Reserved | Confidential for INC Research/inVentiv Health use only 3.
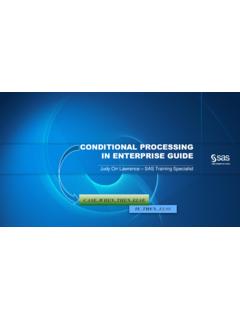
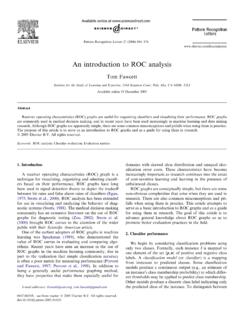
2 ROC ( receiver Operating Characteristic) Curve1. 2017 All Rights Reserved | Confidential for INC Research/inVentiv Health use only 4. Definition2. Sensitivity is the probability of a test will be positive given a patient with the disease Specificity is the probability of a test will be negative given a patient without the disease Sensitivity = TP/(TP+FN) = a/(a+b) Positive predictive value (PPV) = TP/(TP+FP) = a/(a+c). Specificity = TN/(TN+FP) = d/(c+d) Negative predictive value (NPV) = TN/(TN+FN) = d/(b+d). 2017 All Rights Reserved | Confidential for INC Research/inVentiv Health use only 5. Accuracy The accuracy of a test is measured by the area under the ROC Curve (AUC). AUC is the area between the Curve and the x axis. An area of 1 represents a perfect test, while an area of .5 represents a worthless test.
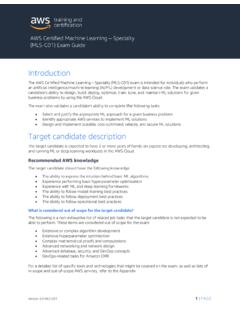
3 The closer the Curve follows the left-upper corner of the plot, the more accurate the test. 2017 All Rights Reserved | Confidential for INC Research/inVentiv Health use only 6. Application in SAS3. PROC FREQ: 2 2 contingency table in PET (Positron Emission Tomography) scan for detecting cancer data cancer;. input Diagnosed $ Observed $ patients;. datalines;. Cancer Cancer 25. Caner No_Cancer 3 Sensitivity = No_Cancer Cancer 42. Specificity = No_Cancer No_Cancer 111. ; PPV = run;. NPV = Proc freq data=cancer;. table diagnosis*observed;. weight patients;. run; Diagnosed cancer if SUV (Standardized Uptake Value) > 7;. Observed cancer determined by gold standard 2017 All Rights Reserved | Confidential for INC Research/inVentiv Health use only 7. Application in SAS4. Developing new biomarkers (BM) that are more specific in detecting drug induced liver injury (DILI) than the commonly used test [elevated alanine transaminase (ALT)].
4 Ods graphics on;. proc logistic data = biom plots = roc;. model status (event= 1') = alt bm1 bm2;. roc BM1' bm1;. roc BM2 bm2;. roc ALT alt;. roccontrast reference( ALT')/estimate e;. run;. ods graphics off;. AUC equals to C-statistics 2017 All Rights Reserved | Confidential for INC Research/inVentiv Health use only 8. Conclusion Threshold Selection - To choose the most appropriate cut-off for a test. The best cut-off has the highest true positive rate together with the lowest false positive rate Assessment of Diagnostic Accuracy - To evaluate the accuracy of a diagnostic test using AUC value to discriminate the diseased cases from normal cases Multiple Tests Comparison - To compare the performance of two or more tests via a visual method 2017 All Rights Reserved | Confidential for INC Research/inVentiv Health use only 9.
5 Reference 1. 2. 3. 4. Gonen, Mithat. 2007. Analyzing receiver Operating Characteristic Curves with SAS. Cary, NC: SAS Institute Inc. 2017 All Rights Reserved | Confidential for INC Research/inVentiv Health use only 10. 2017 All Rights Reserved | Confidential for INC Research/inVentiv Health use only 11. Email: Clinical Division INC Research/inVentiv Health 2017 All Rights Reserved | Confidential for INC Research/inVentiv Health use only 12.