Transcription of Ross.Clark@ChartWorks.ca The Gold Market is …
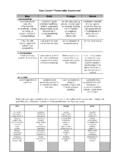
1 chartworks 1/22/2018 1 January 22, 2018 Technical observations of The gold Market is boxed In While gold is off to a good start to the year (up 7% since mid-December) it has yet to take out any significant resistance. In terms of volatility, the width of the long-term 100-week Bollinger Band is at its lowest level since 2002. When the band has been this narrow it has been advantageous to go with the breakout of the support/resistance line. Closing above $1350 or below $1260 should see significant follow-through in bullion and the miners. chartworks 1/22/2018 2 Last week s high of $1345 came 57 weeks after the December 2016 bottom that we are identifying as the eight-year cycle low. As previously noted, highs typically occur from the 55th to 64th week and are followed by a downside correction to the 20-week moving average envelope ($1267) with an oversold CCI(8) reading of -100.
2 From there, four of the five examples rallied to multi-year highs. Even the 1994 exception did manage to rally 8% and the XAU by 28% in the following five months. The first week with a lower low would now be considered the catalyst for the correction. On a daily basis the GLD registered a TD Combo 13 sell on January 16th and the Sequential is at 11 of a possible 13 count. Prices will need to close below four days earlier to create a bearish flip . However, we would want to see a close below $125 in GLD and $1318 in gold (the mid-point of the January 2nd to 11th consolidation) to confirm an interim top is in place. Blue arrows identify the oversold CCI(8) at this point in the 8-year cycle chartworks 1/22/2018 3 Opinions in this report are solely those of the author. The information herein was obtained from various sources; however, we do not guarantee its accuracy or completeness.
3 This research report is prepared for general circulation and is circulated for general information only. It does not have regard to the specific investment objectives, financial situation, and the needs regarding the appropriateness of investing in any securities or investment strategies discussed or recommended in this report and should understand that statements regarding future prospects may not be realized. Investors should note that income from such securities, if any, may fluctuate and that each security s price or value may rise or fall. Accordingly, investors may receive back less than originally invested. Past performance is not necessarily a guide to future performance. Neither the information nor any opinion expressed constitutes an offer to buy or sell any securities or options or futures contracts.
4 Foreign currency rates of exchange may adversely affect the value, price or income of any security or related investment mentioned in this report. In addition, investors in securities such as ADRs, whose values are influenced by the currency of the underlying security, effectively assume currency risk. Moreover, from time to time, members of the Institutional Advisors team may be long or short positions discussed in our publications. BOB HOYE, INSTITUTIONAL ADVISORS EMAIL WEBSITE