Transcription of S&P 500 Equal Weight vs. Cap Weight Sectors
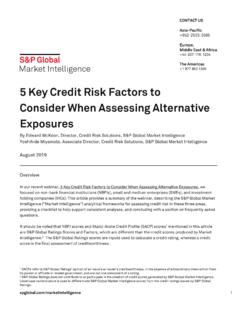
1 INDEX INVESTMENT STRATEGYR egister to receive our dashboards at Equal Weight Sector DashboardAugust 31, 2022 MONTHLY PERFORMANCE SUMMARYTRAILING 12M PERFORMANCE SUMMARYINDEX COMPOSITION AND COMMENTARY*The S&P 500 Equal Weight Utilities Plus IndexSource: S&P Dow Jones Indices LLC and/or its affiliates. Data as of August 31, , Cons , Cons , , , Health , , , Real , Info TechCommunication Services, , UtilitiesS&P 500 Equal Weight Sector Indices The S&P 500 Equal Weight Index outperformed the S&P 500 in August. 7 out of 11 Equal - Weight Sectors outperformed their cap-weighted counterparts. Energy was the top-performing Equal - Weight sector in August. Over the past 12 months, Energy was the leader in both Equal and cap *FinancialsConsumerStaplesMaterialsConsu merDiscretionaryIndustrialsCommunication ServicesTechnologyReal EstateHealth CareS&P 500 Equal Weight vs. Cap Weight SectorsEqual Weight SectorsCap Weighted *ConsumerStaplesMaterialsReal EstateFinancialsIndustrialsHealth CareTechnologyConsumerDiscretionaryCommu nicationServicesS&P 500 Equal Weight vs.
2 Cap Weight SectorsEqual Weight SectorsCap Weighted Equal Weight Sector DashboardAugust 31, 2022 HISTORICAL RETURN DIFFERENTIAL - Equal VS. CAP WEIGHTEDAVERAGE Weight DIFFERENCE OVER PAST YEAR - S&P 500 EW VS. S&P 500 ANNUAL TOTAL RETURN DIFFERENCE - S&P 500 EW VS. S&P 500 Equal VS. CAP WEIGHTED YEARLY ATTRIBUTIONCOMMENTARYS ource: S&P Dow Jones Indices LLC and/or its affiliates and FactSet. Data as of August 31, 2022. 500 Equal Weight (+)Communication Services (+)Utilities (+)Energy (+)Financials (+)Materials (+)Consumer Staples (+)Information Technology (+)Real Estate (+)Industrials (+)Consumer Discretionary (-)Health Care (-)12 Month Attribution -S&P 500 EW vs. S&P 500 Cross Sector WeightingIntra Sector (-) Negative Effect from Equal Weighting (+) Positive Effect fromEqual 500 Equal Weight vs. S&P 500 Total Return Differential -Rolling 12M Equal Weight 's trailing twelve -month relative outperformance continued. Key performance contributors for Equal Weight were the underweight to Communication Services and the overweight to Energy andUtilities.
3 Equal Weight Sector DashboardAugust 31, 2022 KEY TO FACTOR SCORINGS FOR INDICESF actor DefinitionsFactor Measurement at single-stock levelVolatilityMomentumValueBetaDividend QualitySizeIndex ScoresSource: S&P Dow Jones Indices LLC and/or its affiliates. Data as of August 31, - 30 DayPrice/Sales (P/S)Price per share as of observation date divided by sales per share, calculated by adding twelve calendar months' quarterly reported sales per on Equity (ROE%)Earnings per share divided by latest annual reported book value per Leverage RatioA company's total debt divided by its latest annual reported book value, calculated as book value per share multiplied by common outstanding shares. Debt, book value per share, and common outstanding shares are latest annual reported (P/E)Price per share as of observation date divided by earnings per share, calculated by adding the last twelve calendar months' quarterly reported earnings per (P/B)Price per share as of observation date divided by latest annual reported book value per is an indicator of the speed and change of price movements and oscillates between zero and 100.
4 RSI is considered overbought when above 70 and oversold when below 30. RS is the average gain divided by average loss over the past 30 days. Then RSI is Equal to 100 minus 100 divided by 1+ constituent of the S&P 500 index is provided with a factor "score" for each of Beta, Volatility, Momentum, Dividend, Size, Value and Quality. Trailing 12-month daily return volatilityTwelve-month price change as of one month ago ("13 minus 1 momentum"), divided by the daily volatility during the twelve -month period that ended one month ago. For more details, see the S&P Momentum methodologyThe average of (normalized) earnings to price ratio, book to price ratio and sales to price ratio. For more details, see the S&P Value Diagram AxisTrailing 1 year beta of stock daily returns to the benchmark's 12-month dividend The average of the (normalized) return on equity, the negative of the accruals ratio and the negative of the financial leverage ratio. For more details, see the S&P Quality methodology.
5 Free-float market capitalizationIndex Factor Ranking and Factor Diagram ScalingEach index is provided a score in each factor from -100% to +100% based on how much of the total capitalization of the benchmark must be excluded in order to provide a portfolio of stocks with similar exposure to that factor. This is done by examining a ranked series of hypothetical cap-weighted portfolios, including or excluding an increasing number of the stocks with the highest or lowest scores. An illustration of the process may be found at this On Additional Index StatisticsFewerstocksPortfolios with a tilt against the factor begin by excluding the highest-ranked stock and end up concentrated in the lowest-ranked stocksBenchmark Portfolio has a factor rank definedbythat of a cap-weighted average score among all stocksWeighting matters to the ranking of the index. Each the rankedportfolios of stocks is given a factor score through the capitalization-weighted average. Factor indices can use alternative weightings, which can provide higher factor exposures with fewer stocks.
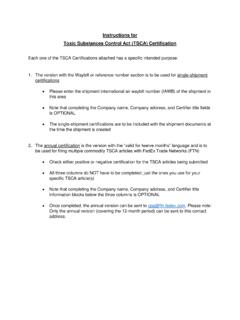
6 Single-stock portfolio with the highest possiblefactor scoreThe stocks in the benchmark are ranked in order from highest to lowest factor score, and we examine portfolios including or excluding a varying number of stocks associated to high or lower factor scores. The score ineach factor (and its level on the chart) reflects the activeshareofa hypothetical portfolios matching the factor score of that index. The weights of stocks within the hypothetical comparison portfolios are set proportional to benchmark weights, free-float market VolatilityMomentumValueHigh BetaDividendQualitySmall SizeS&P500 Single-stock portfolio with the lowest possible factor Equal Weight Sector DashboardAugust 31, 2022 COMMENTARYFACTOR TILTSS ource: S&P Dow Jones Indices LLC and/or its affiliates. Data as of August 31, 500 Equal WEIGHTED Health CareS&P 500 Equal WEIGHTED IndustrialsS&P 500 Equal WEIGHTEDS&P 500 Equal WEIGHTED Communication ServicesS&P 500 Equal WEIGHTED Consumer DiscretionaryS&P 500 Equal WEIGHTED Consumer StaplesS&P 500 Equal WEIGHTED EnergyS&P 500 Equal WEIGHTED FinancialsS&P 500 Equal WEIGHTED Information TechnologyLow_VolatilityMomentumValueHig h_BetaDividendQualitySmall_SizeBenchmark Low_VolatilityMomentumValueHigh_BetaDivi dendQualitySmall_SizeBenchmarkLow_Volati lityMomentumValueHigh_BetaDividendQualit ySmall_SizeBenchmarkLow_VolatilityMoment umValueHigh_BetaDividendQualitySmall_Siz eBenchmarkLow_VolatilityMomentumValueHig h_BetaDividendQualitySmall_SizeBenchmark Low_VolatilityMomentumValueHigh_BetaDivi dendQualitySmall_SizeBenchmarkLow_Volati lityMomentumValueHigh_BetaDividendQualit ySmall_SizeBenchmarkLow_VolatilityMoment umValueHigh_BetaDividendQualitySmall_Siz eBenchmarkLow_VolatilityMomentumValueHig h_BetaDividendQualitySmall_SizeBenchmark The diagrams
7 Below illustrate factor exposures relative to the S&P 500 across Sectors . For example, S&P 500 Equal Weighted Consumer Discretionary has a tilt away from Low Volatility, compared to S&P Equal Weighted Consumer Staples, which has a tilt towards Low Volatility. Equal Weight Sector DashboardAugust 31, 2022 FACTOR TILTSCOMMENTARYEQUAL Weight SECTOR DISPERSION AND CORRELATIONEQUAL Weight VS. CAP Weight CORRELATIONEW cs. Cap W eight hist dispNOTESS ource: S&P Dow Jones Indices LLC and/or its affiliates. Data as of August 31, 2022. Index performance based on total return (USD). Charts and graphs are provided for illustrative purposes. Past performance is no guarantee of future 500 Equal WEIGHTED Utilities PlusS&P 500 Equal WEIGHTED MaterialsS&P 500 Equal WEIGHTED Real EstateS&P 500 Equal Weight ( )Energy ( )Materials ( )Industrials ( )Consumer Discretionary ( )Consumer Staples ( )Health Care ( )Financials ( )Technology ( )Communication Services ( )Utilities ( )Real Estate ( ) CorrelationAverage DispersionS&P 500 Equal Weight Sector Average Correlation and Dispersion (Trailing 12-Month Volatility) Dispersion decreased and correlations increased across most Equal weighted Sectors .
8 The charts above decomposed volatility into its two main components: dispersion and correlation. The dispersion and correlation data points are each sector's average monthly value over the trailing 12 months. Trailing annualized volatility is included in parentheses. Index dispersions shown based on calendar month stock-level index-weighted dispersion. Index correlation based on single stock daily total returns during each calendar month. See"Implications of Sector Dispersion" for more information. See"At the Intersection of Diversification, Volatility and Correlation" for details on the relationship between correlation and dispersion. See"Dispersion: Measuring Market Opportunity" for the definition of index dispersion and more information on the uses of 500 Equal Weight vs. S&P 500 Correlation -Rolling 12M average S&P 500 Equal Weight (TR)S&P 500 (TR) Equal Weight Sector DashboardMETRICSDIV YIELDP/EP/BP/SBETACONSTITUENT VOLATILITYRSI - 30 DAYVALUE SCOREC onsumer details on definitions of fundamental metrics, please refer to the disclosure section.
9 Value and Growth scores are rescored for the S&P Total Market Index universe annually every : S&P Dow Jones Indices LLC and/or its affiliates and FactSet. Data as of August 31, KEY METRICS - Equal Weight SECTOR INDICESTOTAL Weight OF LARGEST 5 COMPANIES WITHIN CAP WEIGHTED Sectors AND Equal Weight RELATIVE PERFORMANCEGROWTH Utilities had the highest relative strength among the Equal weighted sector Weight of Largest 5 Companies in each S&P 500 vs. CW total return differentialWeight of Top 5 CompaniesS&P 500 Weight in Top 5 Names and Equal vs. Cap- Weight Performance Differential Weight of Top 5 Companies in the S&P 500 EW vs. CW total return differentialSTATISTICN otes On Additional Index StatisticsRSI - 30 DayRSI is an indicator of the speed and change of price movements and oscillates between zero and 100. RSI is considered overbought when above 70 and oversold when below 30. RS is the average gain divided by average loss over the past 30 days. Then RSI is Equal to 100 minus 100 divided by 1+ per share as of observation date divided by earnings per share, calculated by adding the last twelve calendar months' quarterly reported earnings per (P/E)NOTESP rice/Book (P/B)Price per share as of observation date divided by latest annual reported book value per (P/S)Price per share as of observation date divided by sales per share, calculated by adding twelve calendar months' quarterly reported sales per DisclaimerCopyright 2022 S&P Dow Jones Indices LLC.
10 All rights reserved. STANDARD & POOR S, S&P, S&P 500, S&P 500 LOW VOLATILITY INDEX, S&P 100, S&P COMPOSITE 1500, S&P MIDCAP 400, S&P SMALLCAP 600, S&P GIVI, GLOBAL TITANS, DIVIDEND ARISTOCRATS, S&P TARGET DATE INDICES, GICS, SPIVA, SPDR and INDEXOLOGY are registered trademarks of Standard & Poor s Financial Services LLC, a division of S&P Global ( S&P ). DOW JONES, DJ, DJIA and DOW JONES INDUSTRIAL AVERAGE are registered trademarks of Dow Jones Trademark Holdings LLC ( Dow Jones ). These trademarks together with others have been licensed to S&P Dow Jones Indices LLC. Redistribution or reproduction in whole or in part are prohibited without written permission of S&P Dow Jones Indices LLC. This document does not constitute an offer of services in jurisdictions where S&P Dow Jones Indices LLC, S&P, Dow Jones or their respective affiliates (collectively S&P Dow Jones Indices ) do not have the necessary licenses. Except for certain custom index calculation services, all information provided by S&P Dow Jones Indices is impersonal and not tailored to the needs of any person, entity or group of persons.