Transcription of Sample Final Exam - Youngstown State University
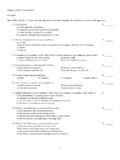
1 Sample Final Exam Econ 3790: Statistics for Business and Economics Instructor: Yogesh Uppal multiple choice Identify the letter of the choice that best completes the statement or answers the question. The material from chapter 7 and beyond will be on the Final . Exhibit 8-2 A random Sample of 49 automobiles traveling on an interstate showed an average speed of 65 mph and a standard deviation of 21 mph. ____ 1. Refer to Exhibit 8-2. If we are interested in determining an interval estimate for at 95% confidence, you would look up which table?
2 A. z b. t c. chi d. F ____ 2. Refer to Exhibit 8-2. The standard error of the mean is a. 21 b. 3 c. 65 d. None of the above ____ 3. Refer to Exhibit 8-2. The margin of error is a. b. c. d. None of the above ____ 4. Refer to Exhibit 8-2. The confidence interval estimate is a. , b. 65, 70 c. , d. None of the above Exhibit 9-2 n = 64 = 50 S = 16 H0: 54 Ha: < 54 ____ 5. Refer to Exhibit 9-2.
3 The test statistic equals a. -4 b. -3 c. -2 d. -1 ____ 6. Refer to Exhibit 9-2. If the test is done at 95% confidence, the null hypothesis should a. not be rejected b. be rejected c. Not enough information is given to answer this question. d. None of these alternatives is correct. Exhibit 9-5 A random Sample of 100 people was taken. Eighty-five of the people in the Sample favored Candidate A. We are interested in determining whether or not the proportion of the population in favor of Candidate A is significantly more than 80%.
4 ____ 7. Refer to Exhibit 9-5. The test statistic is a. b. c. d. ____ 8. Refer to Exhibit 9-5. The p-value is a. b. c. d. ____ 9. Refer to Exhibit 9-5. At 95% confidence, it can be concluded that the proportion of the population in favor of candidate A a. is significantly greater than 80% b. is not significantly greater than 80% c. is significantly greater than 85% d. is not significantly greater than 85% Exhibit 13-5 Part of an ANOVA table is shown below.
5 Source of Variation Sum of Squares Degrees of Freedom Mean Square F Treatment 180 3 Error TOTAL 480 18 ____ 10.
6 Refer to Exhibit 13-5. The mean square due to treatment (MSTR) is a. 20 b. 60 c. 300 d. 15 ____ 11. Refer to Exhibit 13-5. The mean square due to error (MSE) is a. 60 b. 15 c. 300 d. 20 ____ 12. Refer to Exhibit 13-5. The test statistic is a. b. 6 c. d. 3 ____ 13. Refer to Exhibit 13-5. At 95% confidence, you a. think that there is a relationship between the race and the level of cholestrol b. reject the null and find significant differences in the mean scores on the cholestrol test c.
7 Do not reject the null and do not find any significant differences in the mean scores on the cholestrol test d. None of the above ____ 14. A regression analysis between sales (Y in $1000) and advertising (X in dollars) resulted in the following equation = 30,000 + 4 X The above equation implies that an a. increase of $4 in advertising is associated with an increase of $4,000 in sales b. increase of $1 in advertising is associated with an increase of $4 in sales c. increase of $1 in advertising is associated with an increase of $34,000 in sales d.
8 Increase of $1 in advertising is associated with an increase of $4,000 in sales ____ 15. In regression analysis, the variable that is being predicted is the a. dependent variable b. independent variable c. intervening variable d. is usually x ____ 16. The equation that describes how the dependent variable (y) is related to the independent variable (x) is called a. the correlation model b. the regression model c. correlation analysis d.
9 None of these alternatives is correct. ____ 17. In regression analysis, the independent variable is a. used to predict other independent variables b. used to predict the dependent variable c. called the intervening variable d. the variable that is being predicted Exhibit 14-10 The following information regarding a dependent variable Y and an independent variable X is provided. ____ 18. Refer to Exhibit 14-10. The slope of the regression function is a. -1 b. c.
10 11 d. ____ 19. Refer to Exhibit 14-10. The Y intercept is a. -1 b. c. 11 d. ____ 20. Refer to Exhibit 14-10. The coefficient of determination is a. b. c. d. ____ 21. Refer to Exhibit 14-10. The coefficient of correlation is a. b. c. d. ____ 22. Refer to Exhibit 14-10. The MSE is a. 17 b. 8 c. 34 d. 42 ____ 23. Refer to Exhibit 14-10. The point estimate of Y when X = 3 is a.