Transcription of SAMPLE PAPERS - APA Style
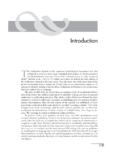
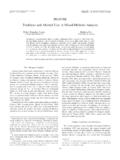
1 SAMPLE PAPERS54 INHIBITORY INFLUENCES ON ASYNCHRONY3 Inhibitory Influences on Asynchrony as a Cue for Auditory SegregationAuditory grouping involves the formation of auditory objects from the sound mixture reaching the ears. The cues used to integrate or segregate these sounds and so form auditory objects have been defined by several authors ( , Bregman, 1990; Darwin, 1997; Darwin &Carlyon, 1995). The key acoustic cues for segregating concurrent acoustic elements are differences in onset time ( , Dannenbring & Bregman, 1978; Rasch, 1978) and harmonic relations ( , Brunstrom & Roberts, 1998; Moore, Glasberg, & Peters, 1986). In an example of the importance of onset time, Darwin (1984a, 1984b) showed that increasing the level of a harmonic near the first formant (F1) frequency by adding a synchronous pure tone changes the phonetic quality of a vowel. However, when the added tone began a few hundred milliseconds before the vowel, it was essentially removed from the vowel [section continues].
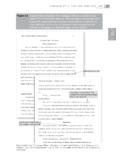
2 General MethodOverviewIn the experiments reported here, we used a paradigm developed by Darwin to assess theperceptual integration of additional energy in the F1 region of a vowel through its effect on phonetic quality (Darwin, 1984a, 1984b; Darwin & Sutherland, 1984)..[section continues].StimuliAmplitude and phase values for the vowel harmonics were obtained from the vocal-tracttransfer function using cascaded formant resonators (Klatt, 1980). F1 values varied in 10-Hzsteps from 360 550 Hz except in Experiment 3, which used values from 350 540 Hz toproduce a continuum of 20 [section continues].ListenersElements of empirical studies, Two-Experiment paper (The numbers refer to num-bered sections in the Publication Manual. This abridged manu-script illustrates the organizational structure characteristic ofmultiple-experiment PAPERS . Of course, a complete multiple-experiment paper would include a title page, an abstract page,and so forth.)
3 paper adapted from Inhibitory Influences on Asynchrony as a Cue for Auditory Segregation, by S. and B. Roberts, 2006, Journal of Experimental Psychology: Human Perception and Performance,32,pp. 1231 1242. Copyright 2006 by the American Psychological STRUCTURE AND CONTENT55 INHIBITORY INFLUENCES ON ASYNCHRONY4 Listeners were volunteers recruited from the student population of the University of Birmingham and were paid for their participation. All listeners were native speakers of British English who reported normal hearing and had successfully completed a screening procedure (described below). For each experiment, the data for 12 listeners are [sectioncontinues].ProcedureAt the start of each session, listeners took part in a warm-up block. Depending on the number of conditions in a particular experiment, the warm-up block consisted of one block of all the experimental stimuli or every second or fourth F1 step in that block.
4 This gave between 85 and 100 randomized trials..[section continues].Data AnalysisThe data for each listener consisted of the number of /I/ responses out of 10 repetitions for each nominal F1 value in each condition. An estimate of the F1 frequency at the phoneme boundary was obtained by fitting a probit function (Finney, 1971) to a listener s identification data for each condition. The phoneme boundary was defined as the mean of the probit function (the 50% point)..[section continues].Experiment 1In this experiment, we used noise-band captors and compared their efficacy with that of a pure-tone captor. Each noise-band captor had the same energy as that of the corresponding pure -tone captor and a center frequency equal to the frequency of this tonal [sectioncontinues].Methodpee timent, we used noise-band captors and compared their efficacy with that of a ach noise-band captor had the same energy as that of the corresponding pure--nter frequency equal to the frequency of this tonal [sectionINHIBITORY INFLUENCES ON ASYNCHRONY5 There were nine conditions: the three standard ones (vowel alone, incremented fourth, and leading fourth) plus three captor conditions and their controls.]
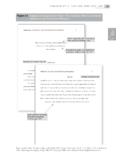
5 A lead time of 240 ms was used for Results and DiscussionFigure 4 shows the mean phoneme boundaries for all conditions and the restoration effect for each captor type. The restoration effects are shown above the histogram bars both as a boundary shift in hertz and as a percentage of the difference in boundary position between the incremented-fourth and leading-fourth [section continues].Experiment 2 This experiment considers the case where the added 500-Hz tone begins at the same time as the vowel but continues after the vowel [section continues].MethodThere were five conditions: two of the standard ones (vowel alone and incremented fourth), a lagging-fourth condition (analogous to the leading-fourth condition used elsewhere), and a captor condition and its control. A lag time of 240 ms was used for the added [section continues]Results and Discussionthe added 500-Hz [section continues].
6 Policy on metrication, ; Style for metric units, unitsof measurement, , Table forms of nounsof foreign origin, Experiments, Two-Experiment paper (continued) SAMPLE PAPERS56 Running head: INHIBITORY INFLUENCES ON ASYCHRONY7a perceptual group between the leading portion and the captor tone, on the basis of their common onset time and harmonic relationship, leaving the remainder of the extra energy to integrate into the vowel .[section continues].[Follow the form of the one-experiment SAMPLE paper to type references, the author note, footnotes , tables, and figure captions.]Running head:INHIBITORY INFLUENCES ON ASYCHRONYa perceptual group between the leading portion and the captor tone, on the basis oINHIBITORY INFLUENCES ON ASYNCHRONY61984; Roberts & Holmes, 2006). This experiment used a gap between captor offset and vowel onset to measure the decay time of the captor effect.
7 [section continues].MethodThere were 17 conditions: the three standard ones (vowel alone, incremented fourth, and leading fourth), five captor conditions and their controls, and four additional conditions (described separately below). A lead time of 320 ms was used for the added 500-Hz tone. The captor conditions were created by adding a pure-tone captor, of various durations, to each member of the leading-fourth [section continues].ResultsFigure 6 shows the mean phoneme boundaries for all conditions. There was a highly significant effect of condition on the phoneme boundary values, F(16, 176) = , p < .001. Incrementing the level of the fourth harmonic lowered the phoneme boundary relative to the vowel-alone condition (by 58 Hz, p < .001), which indicates that the extra energy was integrated into the vowel [section continues].DiscussionThe results of this experiment show that the effect of the captor disappears somewhere between 80 and 160 ms after captor offset.
8 This indicates that the captor effect takes quite a long time to decay away relative to the time constants typically found for cells in the CN usingphysiological measures ( , Needham & Paolini, 2003)..[section continues].Summary and Concluding DiscussionDarwin and Sutherland (1984) first demonstrated that accompanying the leading portion of additional energy in the F1 region of a vowel with a captor tone partly reversed the effect of the onset asynchrony on perceived vowel quality. This finding was attributed to the formation of Use of statistical term rather than symbol in text, Two-Experiment paper (continued)