Transcription of Sanlam Global Equity Fund - Investor Relations
1 ASISA Fund ClassificationGlobal - Equity - GeneralRisk profileHighBenchmarkMSCI World Index (Developed Markets)Fee class launch dateClass A: 02-07-2001 Portfolio launch date01 February 1995 Minimum investmentClass A: Lump sum: R10 000 Monthly: R500 Portfolio SizeR 647 millionLast two distributionsClass A:31/12/17: 0 cents per unit30/06/18: cents per unitIncome decl. dates30/06 | 31/12 Income price dates1st working day after declaration*Portfolio valuation time15:00 Transaction cut off time15:00 Daily price informationThe Local newspaper and period3 working daysThe Fund is an actively managed Rand denominated Global Equity fund aiming to deliver superior returns over the long term by investing in a carefully selected, diversified basket of shares across the globe.
2 Fund ObjectiveThe Fund employs an active, conviction-driven management style. Key to the fund is its focus on identifying growing companies with competitive franchises and strong cash generation. The fund is managed by the highly experienced FOUR Capital Partners (UK) Global investment team with its unique Intrinsic Value investment approach. The portfolio may also invest in participatory interests of underlying unit trust Strategy Investors seeking exposure to a diversified portfolio of international equities targeting long term growth are well suited to invest in this fund. The fund provides a high degree of protection against potential Rand depreciation.
3 The fund is well suited to be used as the Global Equity component within a diversified multi-asset portfolio. It is a Rand denominated international fund. No foreign exchange tax clearance is choose this fund?Fund InformationRisk Considerations The fund is focused on investment in Global listed companies; accordingly the performance of the fund is directly linked to the performance of Global Equity markets. Investing in international companies means the currency exchange rate fluctuations will impact on the fund s performance. As the SA Rand can be a volatile currency, this could lead to significant fluctuations in the Rand value of this 10 HoldingsTop 10% of PortfolioExpress SPA / AllocationPerformance (Annualised) as at 30 Jun 2018 on a rolling monthly basisRetail ClassFund (%)Benchmark (%)1 annualised rate of return is the average rate of return per year, measured over a period either longer or shorter than one year, such as a month, or two years, annualised for comparison with a one-year (Cumulative) as at 30 Jun 2018 on a rolling monthly basisRetail ClassFund (%)Benchmark (%)
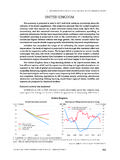
4 1 return is the aggregate return of the portfolio for a specified figures sourced from Statistics: 3 years to 30 Jun 2018 Std Deviation (Ann) Ratio (Ann) highest and lowest annual returns*Highest Annual % Annual % monthly Minimum Disclosure Document should be viewed in conjunction with the Glossary of Terms date: 23 July 2018(Fund Fact Sheet) Sanlam Global Equity FundJune 20181. All commentary performance figures are gross of fees and quoted in US dollar terms unless stated second quarter of 2018 was less eventful than the first in terms of market drama and volatility. There was a broad decline in market volatility, as measured by the VIX Index during the quarter, though levels have not quite declined to those seen in 2017.
5 Capital markets have become less concerned about the threat of inflation running away, and therefore expect the US Federal Reserve to continue to raise interest rates at a more measured pace, with the second quarter seeing another rise. Elsewhere central banks have been significantly more conservative in raising interest rates, and while there was temporary expectation of such a hike in the UK during the quarter this failed to materialise. In Europe, progress towards ceasing non-conventional monetary policy continued, while Japan remains committed to raising inflation levels and hence policy remains accommodative.
6 However, in China the most recent move has been to loosen policy in the face of a potential major event of the quarter was the escalation of the trade war initiated by President Trump. While this has been primarily focused on the trade relationship of the US with China, it has widened. While the extent of the tariffs announced so far is relatively limited in an overall Global GDP context, the market perceives these to be steps in the wrong direction, and has become concerned about the extent of how far this will go. Markets have been unsurprised by China s retaliatory response, but the European Union has also raised concerns about the impact of Trump s actions.
7 For now there is more rhetoric than economic consequence, but the longer this persists the more concerning markets are expected to become. Additionally, during the quarter, at a more political level, the US North Korean submit in June marked a significant turnaround from political language and tone in 2017 and early 2018, and so markets have benefitted from the de-escalation of the threat of war on the Korean peninsula. Unrelated, but notable for the quarter was the rise in the oil price from the low $60s a barrel into the $70s, thus leaving the oil price at the highest levels seen since the end of the quarter Global Equity markets, as measured by the MSCI World Index, rose by.
8 For the calendar months during the quarter the MSCI World produced a positive return in April and May of and respectively, but moved sideways in June with a return of As a result Global Equity markets have progressed a modest year-to-date, but remain in double figures over a one-year period because of the strength of returns in 2017. Using MSCI indices, within the Developed Markets, North America was the strongest region, rising , while Europe declined by and Japan by , though the Pacific ex Japan region rose by However, much of this masks the impact of the US Dollar over the quarter, which remained strong, and hence in local terms all the major developed markets produced positive returns during the quarter.
9 The Pacific ex Japan region rose , while Europe rose more than 4%, but Japan only , and the North American region was not materially different to the US Dollar return, because of the weight of the US in North America. One area that clearly struggled during the quarter was Emerging Markets, which, using the MSCI index, fell by 8% over the quarter and is now lagging Developed Market equities on a one-year Manager(s) Quarterly CommentFees (Incl. VAT)A class (%)Advice initial fee (max.) initial fee0 Advice annual fee (max.) annual Expense Ratio (TER) fee | Any advice fee is negotiable between the client and their financial advisor.
10 An annual advice fee negotiated is paid via a repurchase of units from the a personalised cost estimate before investing by visiting and using our Effective Annual Cost (EAC) calculator. Alternatively, contact us at 0860 100 EXPENSE RATIOSPERIOD: 01 April 2015 to 31 March 2018 Total Expense Ratio (TER) | of the value of the Financial Product was incurred as expenses relating to the administration of the Financial Product. A higher TER does not necessarily imply a poor return, nor does a low TER imply a good return. The current TER may not necessarily be an accurate indication of future TER s. Transaction Cost (TC): of the value of the Financial Product was incurred as costs relating to the buying and selling of the assets underlying the Financial Product.