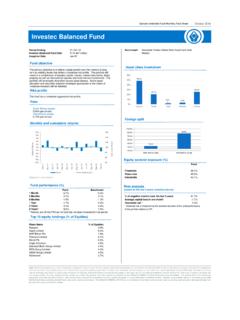
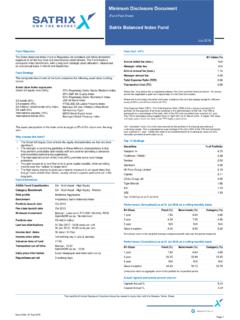
Transcription of Sanlam Investment Management Bond Plus Fund
1 Total Expense Ratio (TER) | PERIOD: 01 April 2015 to 31 March 2018 Total Expense Ratio (TER) | of the value of the Financial Product was incurred as expensesrelating to the administration of the Financial Product. A higher TER does not necessarily imply apoor return, nor does a low TER imply a good return. The current TER may not necessarily be anaccurate indication of future TER Cost (TC) | of the value of the Financial Product was incurred as costs relatingto the buying and selling of the assets underlying the Financial Product. Transaction Costs are anecessary cost in administering the Financial Product and impacts Financial Product returns. Itshould not be considered in isolation as returns may be impacted by many other factors over timeincluding market returns, the type of Financial Product, the Investment decisions of the investmentmanager and the Investment Charges (TER + TC) | of the value of the Financial Product was incurred ascosts relating to the Investment of the Financial portfolio manager may borrow up to 10% of the market value of the portfolio to bridgeinsufficient liquidity.
2 This fund is also available via certain LISPS (Linked Investment ServiceProviders), which levy their own fees. Fluctuations or movements in exchange rates may causethe value of underlying international investments to go up or 10 HoldingsSecurities% of PortfolioR2048 Republic of South Africa RSA RSA Republic of South Africa Republic of South Africa Republic of South Africa ESKOM Republic of South Africa Republic of South Africa Standard Bank 10 Holdings as at 30 Jun 2018 Performance (Annualised) as at 30 Jun 2018 on a rolling monthly basisRetail ClassFund (%)Benchmark (%)1 return is the weighted average compound growth rate over the period (Cumulative) as at 30 Jun 2018 on a rolling monthly basisRetail ClassFund (%)Benchmark (%)
3 1 return is aggregate return of the portfolio for a specified periodRisk statistics: 3 years to 30 Jun 2018 Std Deviation (Ann) Ratio (Ann) highest and lowest annual returns*Highest Annual % Annual % highest and lowest 12-month returns are based on a 12-month rolling period over 10 years orsince inception where the performance history does not exist for 10 Investment Management Bond PlusFundJune 2018 (Fund Fact Sheet)Fund ObjectiveThe fund aims to offer both income and capital growth through a well diversifiedbond portfolio. This fund may invest 30% StrategyThe fund will invest in a basket of permitted public and private fixed-interestsecurities with the aim of outperforming the BEASSA All Bond Index. This portfoliomay also invest in participatory interests of underlying unit trust choose this fund?
4 *This fund gives you active exposure to the South African bond market and shouldform part of a well diversified portfolio.*The fund aims to achieve capital growth by investing in long term fixed interestsecurities.*Over time, the fund should produce returns in excess of a money market fund, butat higher InformationASISA Fund ClassificationSA - Interest Bearing - Variable TermRisk profileCautiousBenchmarkBEASSA All Bond IndexPortfolio launch date01 Aug 1996 Fee class launch date01 Aug 1996 Minimum investmentLump sum: R10 000 | Monthly: R500 Portfolio sizeR1 two distributions30 Jun 2018 : cents per unit31 Dec 2017: cents per unitIncome decl. dates30 Jun | 31 DecIncome price dates1st working day in January and JulyValuation time of fund15:00 Transaction cut off time15:00 Daily price informationLocal newspaper and period3 working daysFees (Incl.)
5 VAT)Retail Class (%)Advice initial fee (max.) initial feeN/AAdvice annual fee (max.) annual Expense Ratio (TER) 1 This monthly Minimum Disclosure Document should be viewed in conjunction with the Glossary of Terms Date: 24 Jul 2018 Asset Allocation Cash and Money Market Assets Bonds 0 - 3 years Bonds 3 - 7 years Bonds 7 - 12 years Bonds 12+ Manager(s) Quarterly Comment - 30 Jun 2018 Trump makes good on election promiseUS President Donald Trump ran for office promising to renegotiate the Iran nucleardeal and on 12 May, he pulled the US out of the 2015 Iran Nuclear Accord byrefusing to grant Iran sanctions relief. While the other international powers are tryingto keep the deal alive, the Trump administration seems determined to isolate Iran byimposing sanctions on companies or countries that should do business with prospect of increasing sanctions on Iran has resulted in higher oil prices.
6 Oilprices have also been driven by constrained supply from Venezuela and crude prices rose by in Dollar terms to $ from $ per tariffs on solar panels and washing machines in January, Trump uppedthe ante by imposing tariffs on steel and aluminium imports of 25% and 10%respectively, effective 1 June. Europe, Canada and China have responded byimposing tariffs on American imports of similar value. The tariffs imposed so faraffect about $58 billion of imports compared to total trade between Europe and theUS of about $ trillion. The markets have reacted negatively because Trump haspromised to implement tariffs on another $200 billion of goods should tradingpartners impose retaliatory tariffs of their previously wrote how the weakness in the US Dollar had encouraged capitalflows into emerging market (EM) local currency bonds.
7 This trend reversed in thesecond quarter, with the Dollar (index) gaining 5% against major currencies. TheDollar benefited from continued strong growth in the US and a more hawkishFederal Reserve (Fed). The Federal Open Market Committee (FOMC) raised thefederal funds rate by another 25 basis points (bps) in June, while the dot plotindicated that most Fed governors expect another two rate hikes before the year isout - a total of four rate hikes in market reviewBond yields in developed markets (DM) were mixed; US 10-year yields rose to while yields in Europe, Britain and Japan rallied. Bond yields in theUS were pressured by increased supply and chances of more rate hikes. However,10-year yields ended the quarter well off their highs as the curve continued toflatten.
8 An inverted yield curve is considered a predictor of economic strong Dollar pressured EM currencies like the Rand and Turkish Lira, whichare perceived to have weak fundamentals. Yields on Turkish bonds rose more than200 bps even as the central bank raised the policy rate, first by 300 bps and then by125 bps to counter a 20% fall in the currency and inflation of 12%. Afteroutperforming its EM peers in the first quarter, South African bonds and the Randsold off in the second quarter as foreign investors liquidated their holdings of R30billion and billion in May and June respectively. The yield on the benchmarkR186 bond rose 83 bps during the quarter from 8%, resulting in a return forthe FTSE/JSE All Bond Index. The Rand lost 16% against the US Dollar during price inflation printed at in April and in May.
9 The increase ininflation from in March was driven mainly by tax increases and used the sell-off as an opportunity to add duration, taking the funds from anunderweight position to moderately long duration at the higher levels. We thinkSouth African bonds offer value when the 10-year bond yield is between We reduced exposure to corporate credit in favour of long-dated governmentbonds, which offer increased duration and capital gains when yields decline. Creditspreads continued to compress as demand outstripped continued to compress as demand outstripped market outlookThe outlook for (DM) bonds remains poor given a combination of lower liquidity ascentral banks buy less government bonds, increasing inflation and larger deficits inthe US.
10 We think yields in the US will end 2018 closer to 3%, perhaps even a littlehigher. However, guidance from the European Central Bank to keep rates on holduntil the end of summer 2019 will have a dampening effect on yields in imposition of trade tariffs between the major economies could lead to anall-out trade war and a slowdown in global trade, which would not be good for EMsas risk aversion would lead to more capital flight towards DMs. Current oil prices, ifsustained, pose a threat to our constructive view on bonds, and realised inflationwould be higher than we the domestic front inflation risks have risen too. The National Energy Regulatorof South Africa has granted Eskom additional revenues of billion over andabove the annual increases.


