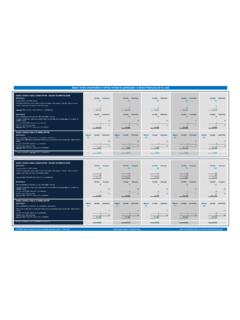
Transcription of Sasol Limited Group Production and sales metrics
1 Sasol Limited Group Production and sales metricsfor the period ended 31 March% changeYTD MarchYTD MarchFull yearMining2018 vs 2017201820172017 ProductionSaleable Production mm tons327,226,336,0 External purchasesmm tons(18)5,16,28,0 Internal salesEnergymm tons(5)17,017,923,8 Base Chemicalsmm tons 9,99,912,9 Performance Chemicalsmm tons(6)3,33,54,8 External salesInternational and other domesticmm tons92,42,23,0 Exploration and Production International ProductionNatural gas - Canada bscf(11)14,916,821,9 Condensate - Canada m bbl(18)58,772,085,6 Natural gas - Mozambique ( Sasol 's 70% share)bscf 86,786,9116,6 Condensate - Mozambique ( Sasol 's 70% share) m bbl(22)200255325 Crude oil Gabon (after royalties) m bbl(13)8589911 279 External salesNatural gas - Canadabscf(11)14,916,821,9 Condensate - Canadam bbl(18)58,772,085,6 Natural gas - Mozambique bscf(8)
2 11,112,116,2 Condensate - Mozambiquem bbl(20)202253328 Crude oil Gabon (after royalties)m bbl(10)8499461 293 Internal salesNatural gas - Mozambique to Energybscf(2)40,441,254,7 Natural gas - Mozambique to Base Chemicalsbscf(3)14,815,320,8 Natural gas - Mozambique to Performance Chemicalsbscf1120,418,324,9 Energy ProductionSynfuels refined product (white product) mm bbl(4)23,424,532,5 Natref Crude oil (processed)mm bbl(15)13,315,620,3 White product yield%89,289,589,3 Total yield%97,196,896,9 Productionmm bbl(15)12,915,119,7 ORYX GTL Productionmm bbl(5)3,974,185,49 Utilisation rate of nameplate capacity%919695 Escravos GTL (EGTL) Production ( Sasol 's 10% share)mm bbl>1000,440,020,16 External purchasesWhite productmm bbl446,94,86,7 Natural gas*bscf(2)17,317,723,4 Internal purchasesCoal (Mining)mm tons(5)17,017,923,8 Natural gas (EPI)bscf(2)40,441,254,7 SalesLiquid fuels - white product mm bbl(1)
3 41,942,457,4 Liquid fuels - black product mm bbl(6)1,71,82,6 Natural gasbscf(1)24,825,033,5 Methane rich gas bscf(12)16,318,623,3 Retail convenience centres (RCCs) number1397394397*Reflects natural gas purchases from the 30% JV partners in Mozambique. Sasol Limited Group % changeYTD MarchYTD MarchFull yearBase Chemicals 2018 vs 2017201820172017 External purchasesNatural gas*bscf(3)6,46,68,9 Internal purchasesCoal (Mining)mm tons 9,99,912,9 Natural gas (EPI)bscf(3)14,815,320,8 sales Polymerskt(2)1 2461 2761 669 Solventskt 729728982 Fertilizerskt(1)352356437 Explosiveskt1247245325kt(1)
4 2 5742 6053 413 Normalised total (asset disposals & business changes and planned shutdowns)kt(1)2 5742 6053 436 Base Chemicals sales basket price $/ton12869774793 Performance Chemicals External purchasesNatural gas*bscf128,77,810,7 Internal purchasesCoal (Mining)mm tons(6)3,33,54,8 Natural gas (EPI)bscf1120,418,324,9 Total feedstock cost** R/ton77 1556 6576 542 Total feedstock cost** EUR/ton4464446441 SalesOrganics Rm436 60935 09746 972 WaxesRm56 4276 1018 260 OtherRm27 4417 2989 915Rm450 47748 49665 147 sales volumesOrganics kt31 5491 5112 040 Waxes kt5379360482 Otherkt(1)52452771122 4522 3983 233*Reflects natural gas purchases from the 30% JV partners in Mozambique.
5 **Includes feedstock cost of natural gas, coal and foreign currency denominated feed streams. The cost is therefore impacted by currency fluctuations of the rand against major MarchFull yearLake Charles Chemicals Project 20182017 Cumulative capital expenditure to dateUS$m9 1907 500 Percentage of completion%8574 Full yearFull yearSignificant open hedges - Sasol Group 20182019 Brent oil - put optionsNumber of barrels hedgedmm bbl12,7530,00 Average Brent crude oil price floor, net of costsUS$/bbl47,0151,88 Rand/US dollar currency - zero-cost collar instrumentsUS$ exposure hedged US$bn1,002.
6 25 Annual average floorR/US$13,3214,01 Annual average capR/US$15,3816,17 Export coal - swapsNumber of tons hedgedmm tons0,701,40 Average coal swap priceUS$/ton75,8481,82 Ethane gas - swapsNumber of barrels hedgedmm bbl1,401,50 Average ethane gas swap priceUS$ c/gal27,4127,68 Sasol Limited Group Commentary1We are still ramping up towards targeted productivity levels. However, since December 2017, our mining operations were significantly impacted by four tragic fatalities at different mines which resulted in lower than expected Production volumes.
7 Safety remains a top priority and we are taking action to restore the safety focus at our operations. Our business improvement programme (BIP), aimed at increasing productivity and achieving cost efficiency, is currently underway and has already yielded higher productivity rates since March gas volumes produced due to a reduction in the number of new wells due to higher dry gas Production from Pande gas wells, which results in lower Production during Q3 due to the natural decline of the decreased due to lower market demand in Synfuels Operations (SSO)
8 Total Production volumes decreased by 3% mainly as a result of an unexpected Eskom supply interruption and internal outages. This, as well as a higher portion of the Production volumes being allocated to our chemical businesses, reduced the Production of refined products by 4%.7 Through our focused efforts and management actions, Natref delivered a strong performance during Q3FY18 with an improved Production run rate of 639m /h . The increased volumes in Q3 FY18, partially offsets the lower Production volumes recorded in the first half of the year.
9 We are of the view that this positive trend will continue in the ensuing GTL Production achieved an average utilisation rate of 91% due to planned plant shutdowns during the period. The plant remains on track to achieve the market guidance of a 92% utilisation rate for the full EGTL, optimisation efforts to reduce costs and improve plant efficiency are progressing well. Planned maintenance work is underway to ramp up the plant towards design , liquid fuels sales volumes decreased by 1% due to lower allocated volumes from SSO.
10 Our sales performance in Q3 FY18 improved, despite challenging South African liquid fuels market rich gas sales volumes decreased by 12% mainly due to lower market demand. The gas was however re-routed and utilised in our integrated value the period, we opened six new retail convenience centres (RCCs) and divested from six non-operating RCCs. A further six RCCs are planned to come on-stream by the end of Base Chemicals sales volumes decreased by 1% mainly due to an initial stock build for our high density polyethylene joint venture in the US that reached beneficial operation during November 2017.
