Transcription of SCADA SIMULATION OF A DISTRIBUTED GENERATION …
1 25 Scientific Bulletin of the Petru Maior University of T rgu Mure Vol. 11 (XXVIII) no. 2, 2014 ISSN-L 1841-9267 (Print), ISSN 2285-438X (Online), ISSN 2286-3184 (CD-ROM) SCADA SIMULATION OF A DISTRIBUTED GENERATION SYSTEM WITH POWER LOSSES Lucian Ioan DUL U1, Mihail ABRUDEAN2, Dorin BIC 3 1,2 Technical University of Cluj-Napoca George Bari iu Street, No. 26-28, 400027, Cluj-Napoca, Romania 3 Petru Maior University of T rgu-Mure Nicolae Iorga Street, No. 1, 540088, T rgu-Mure , Romania Abstract In this paper we present the SIMULATION of a DISTRIBUTED GENERATION system. The SIMULATION is performed using the facilities of CitectSCADA software considering the loads profile, the availability of the generating units and the power losses.
2 In order to cover the total load, the generating units are dispatched in ascending order of their power production costs, with the remark that if one of the DISTRIBUTED GENERATION (DG) units is connected to the grid, then these DGs will be dispatched first due to the availability of their primary source. Key words: distributes GENERATION , SIMULATION , SCADA , GENERATION dispatch, power losses, power cost 1. Introduction DISTRIBUTED GENERATION (DG) refers to the production of power near or at the consumption place. The DISTRIBUTED GENERATION resources that are used for generating power are the combined heat and power or cogeneration (CHP) units and the renewable energy sources (RES).
3 The location of these DISTRIBUTED GENERATION resources in the power system depends on the presence and availability of their primary energy source (such as wind, water etc.). The most common DG technologies and their typical module size are: Wind Turbine: 200 W - 3 MW; photovoltaic Arrays (PV Arrays): 20 W - 100 kW; Small Hydro: 1 - 100 MW; Micro Hydro: 25 kW - 1 MW; Geothermal: 5 - 100 MW; Ocean Energy: 100 kW - 5 MW; Biomass Gasification: 100 kW - 20 MW; Battery Storage: 500 kW - 5 MW. DISTRIBUTED GENERATION has several characteristics which are not present in traditional centralized power systems.
4 The most important characteristic is the fact that the power generated by DISTRIBUTED generators is relatively small and has fluctuations dependent on the availability and variability of primary energy source. Another important characteristic is that the power flow is bidirectional (from the DG to the power grid or from the DG to the consumers), in comparison with the central GENERATION system where the power flow is unidirectional. The presence of DGs in a power system has an important role in improving the reliability of the grid, improving the power quality, reducing the transmission losses, reducing the greenhouse emissions and providing better voltage support.
5 The major impediment for a widespread acceptance of DISTRIBUTED GENERATION has been the high cost of the power produced by these generators. However, this cost has decreased significantly over the past years. This paper is a further study of the work presented in [1]. In [1] the SIMULATION was performed for the IEEE 30 bus test system in which three DGs were included. In the SIMULATION we considered all the loads as a single total load, and also the power losses were not considered. The SIMULATION presented in this paper will be performed for a four bus test system. The simulations presented in other papers ([2-14]), are focused on the analysis of power generated by DISTRIBUTED generators (usually photovoltaic , wind systems or small hydro systems) considering the wind speed, water flow speed etc.
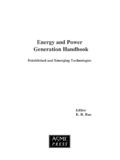
6 Or dispatch of power in the electric grid. The DISTRIBUTED generators were connected to the power grid or isolated from the power grid. Also, in these papers the power losses were not considered in the simulations. 26 In this paper the SIMULATION performed for the test system will consider the power losses, which will be subtracted from the total generated power. 2. Test system In this paper we present a SCADA SIMULATION of a DISTRIBUTED GENERATION system, for the application test system in Fig. 1, considering the power losses. Fig. 1: Test system The power losses will be determined with the Neplan software [15], using the Newton-Raphson extended method.
7 The method starts from initial values of all unknown variables (voltage magnitude and angles at load buses and voltage angles at generator buses). A Taylor series is written, with the higher order terms ignored, for each of the power balance equations included in the system of equations. The result is a linear system of equations that can be expressed as: QPJV1|| (1) NkikikikikkiiiBGVVPP1)sincos(|||| (2) NkikikikikkiiiBGVVQQ1)cossin(|||| (3) ||||VQQVPPJ (4) where: |V| - voltage magnitude; , ik - voltage phase ( ), and voltage angle difference between the i and k buses ( ik); Pi - net power injected at bus i; Gik, Bik - the real and imaginary part of the element in the bus admittance matrix corresponding to the i row and k column; P, Q - the mismatch equations; J - matrix of partial derivatives (Jacobian).
8 The linearized system of equations is solved in order to determine the next value (m+1) of voltage magnitude and angles based on: ||||||;11 VVVmmmm (5) The process continues until the norm of the mismatch equations are below a specified tolerance. The data for each generating unit are presented in table 1. Table 1: Generators data Type Installed power (MW) Generator 1 (G1) -Thermoelectric power plant 70 Generator 2 (G2) -Hydroelectric power plant 66 Generator 3 (G3) Wind turbine 2 Generator 4 (G4) Micro hydro 1 The power demand for the first load is 30 MW, respectively 45 MW for the second load.
9 The Romanian National Energy Regulatory Authority (ANRE) [16] sets the average prices for the production of electric energy from different sources that are presented in table 2. Table 2: Average prices for the production of electric energy from different sources Energy type Average price [lei/MWh] Nuclear energy 142 Hydroelectric energy 125 Thermoelectric energy 190 Producers beneficiaries of the bonus support scheme type that produce electricity from high efficiency cogeneration 189 Producers with dispatchable energy units 189 The power flow results considering different grid connections for the DGs are presented in table 3.
10 The results will be considered in the SIMULATION . 27 Table 3: Power flow results DISTRIBUTED generators connection Active power losses (MW) G3 (Wind turbine) and G4 (Micro hydro) are off-grid G3 (Wind turbine) is on-grid and G4 (Micro hydro) is off-grid G3 (Wind turbine) is off-grid and G4 (Micro hydro) is on-grid G3 (Wind turbine) and G4 (Micro hydro) are on-grid From table 3 it can be observed that the power losses are lower if the DISTRIBUTED generators are on-grid. These values will be used in the SIMULATION presented further. The DISTRIBUTED generators output, that will be used in the SIMULATION is presented in Fig.