Transcription of Scope 1, 2 and 3 emissions calculation methodology 2020
1 Scope 1, 2 and 3 emissions calculation methodology 2020 This document describes the approach used in the preparation of our 2020 Scope 1, 2 and 3 greenhouse gas (GHG) emissions 1 emissions are direct GHG emissions from operations in which we have an equity interest. Scope 2 emissions are indirect emissions from the generation of purchased energy at these operations. Our 2020 Scope 1 and 2 emissions data is reported and disclosed in detail in our Climate Change Report. Details of how our Scope 1 and 2 emissions inventories were prepared, along with details outlining how our 2030 climate targets are calculated, are included in this report. Scope 3 emissions are indirect GHG emissions generated as a result of activities undertaken either upstream or downstream of our operations.
2 To identify and calculate Scope 3 emission sources across our operations, we have used the World Resources Institute (WRI) and World Business Council for Sustainable Development (WBCSD) , Greenhouse Gas (GHG) Protocol: A Corporate Accounting and Reporting Standard (Revised Edition) (2015), GHG Protocol Corporate Value Chain ( Scope 3) Accounting and Reporting Standard (2013) and the Technical Guidance for Calculating Scope 3 emissions (version ). Available at 2020 Scope 3 emissions inventory has been prepared on an equity basis, taking in to account Rio Tinto s relevant interest in all managed and non-managed operations. The Scope 3 Standard divides Scope 3 emissions into fifteen categories covering activities both upstream and downstream of our these categories, Category 10 Processing of Sold Products accounts for almost 97% of the identified emissions across our value chains.
3 Accordingly, this report focuses on the calculation boundary, methodology and data sources used to estimate these emissions . We estimated emissions from downstream processing of iron ore, bauxite, alumina, titanium dioxide and copper concentrate using a combination of internal emissions modelling, regional and industry level emissions factors and internal production and shipments data. We engaged an independent external assurance organisation PricewaterhouseCoopers to provide the directors of Rio Tinto with assurance on the Scope 3 emissions estimates related to processing of these sold products and other selected subject matter set out in this report. With the support of EY, we evaluated the remaining categories that make up the balance of our Scope 3 emissions and, where applicable, we have produced estimates for each category using the most appropriate methodologies.
4 Notably, we have reported zero emissions for Category 11 Use of Sold Products, as we do not mine coal or extract oil and gas. About this documentThe methodology and inventory presented in this report provide relevant details related to the emissions in our operations and value chains, as published in the Rio Tinto Annual Report 2020, Our Approach to Climate Change 2020, all available at 1, 2 and 3 emissions calculation methodology 2020 ContentsScope 1 and 2 emissions ..4 Scope 3 emissions summary ..6 Processing of sold products ..7 Processing of iron of bauxite and alumina ..11 Processing of titanium dioxide feedstocks ..13 Processing of copper concentrate ..15 calculation methodology All Scope 3 Standard emissions categories.
5 17 PwC Assurance Statement ..193 Scope 1, 2 and 3 emissions calculation methodology 2020 Scope 1 and 2 emissions Organisational boundaryRio Tinto plc and Rio Tinto Limited combined (Rio Tinto) use Scope 1 and Scope 2 emissions definitions that are consistent with the World Resources Institute (WRI) and World Business Council for Sustainable Development (WBCSD) , Greenhouse Gas (GHG) Protocol: A Corporate Accounting and Reporting Standard (Revised Edition) (2015). Available at This standard defines Scope 1 greenhouse gas emissions as direct greenhouse gas emissions from facilities owned or controlled by an operator, including fuel use, on-site electricity generation, anode and reductant use, process emissions and land management.
6 Greenhouse gas emissions from the generation of electricity, heat or steam brought in from third parties are defined as Scope 2 (indirect emissions ). Scope 1 and 2 emission factors for our Australian operations are consistent with the Australian National Greenhouse and Energy Reporting (Measurement) Determination 2008. For non-Australian operations, factors from the Intergovernmental Panel on Climate Change (IPCC) Guidelines for National Greenhouse Gas Inventories (2006) are used for Scope 1, and where possible factors for Scope 2 are sourced from electricity supplier or the appropriate regional and sub-regional Greenhouse Gas (GHG) emissions DataUp until 2018, we reported our greenhouse gas emissions using the operational control approach.
7 As part of introducing new targets in 2020 we have moved from an equity approach which included re-stating our 2018 baseline on an equity we do not have operational control, we work with the relevant operators to source emissions data. If we are unable to source data for a full-year, we estimate data using the trend in available data and / or observable comparable data at any of our managed operations. Scope 1 and 2 - 2030 target calculation methodologyIn 2019, we looked at our operations in detail to explore emission reduction opportunities for each asset and developed corresponding marginal abatement cost curves. This comprehensive work informed our 2030 targets which are to reduce our emissions intensity by 30% and our absolute emissions by 15%, measured against a baseline of use the equity share approach for consolidating our total Scope 1 and 2 GHG emissions , to which we apply the benefit of our use of valid offsets.
8 This approach applies to both absolute and intensity calculations, where our equity share of production from managed and non-managed operations is used when determining our GHG emissions intensity. In order to account for the different commodities across our business, our production is calculated on a copper equivalent year we will provide details on our performance against these targets by reporting the percentage change for the relevant year compared to our emissions baseline in specific circumstances we may apply appropriate adjustments to the 2018 baseline data. Acquisitions and divestments will result in a commensurate adjustment to the baseline to include (acquisition) or exclude (divestment) the relevant operation from the baseline.
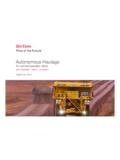
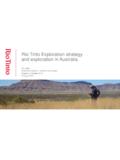
9 Permanent closure of assets will not result in any adjustment to the baseline. Similarly, we will not adjust the baseline if our global production increases from the expansion of existing operations or new projects, such as Winu in Australia or Jadar in Serbia. These growth projects are expected to be carbon neutral overall so that we can deliver against our absolute and intensity targets. The control approach accounts for 100% of GHG emissions from operations where we have operational control (managed operations). GHG emissions from operations that are not controlled by Rio Tinto (non-managed operations) are excluded from the consolidation. The equity share approach accounts for all GHG emissions in accordance with our share of equity in an operation, which includes managed and non-managed Tinto Example slides | July 2020 Where weoperate1 AluminiumCopper & DiamondsEnergy & MineralsIron OreKeyMines and mining projectsSmelters, refineries, power facilitiesand processing plants remote from mineNon-managed operationsNorth AmericaEuropeSouth AmericaAfricaAsiaAustralasiaManaged and non-managed emissions4 Scope 1, 2 and 3 emissions calculation methodology 2020 Scope 1 and 2 emissions summary Scope 1&2 emissions - Equity basisTotal equity greenhouse gas emissions - million tonnes carbon dioxide equivalent (Mt CO2-e )
10 202020192018 Total * Scope 1 2 equity greenhouse gas emissions by product group (Mt CO2-e ) Scope 1 emissions (Mt CO2-e) Scope 2 emissions (Mt CO2-e)Total emissions (Mt CO2-e) (Pacific) (Canada) & & & (includes Growth & Innovation and corporate functions) 1&2 emissions & energy - 100% managed basisTotal managed greenhouse gas emissions (Mt CO2-e )202020192018201720162010 Total managed greenhouse gas emissions (Mt CO2e) managed energy (PJ)402406425440458 Note: Total managed GHG emissions equal the sum of Scope 1 emissions and Scope 2 emissions minus the Scope 1 emissions resulting from the supply of electricity and steam to third parties minus net carbon credits voluntarily purchased from, or sold to, recognised sources.