Transcription of Scope Notes - University of Waterloo
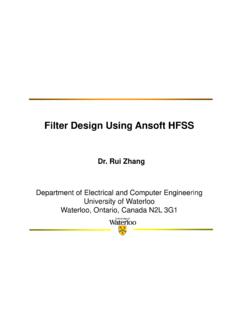
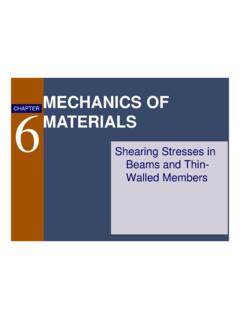
1 2009 E&CE Dept. University of Waterloo page-1 Figure 1. X vs. Y Deflection Block Diagram of the CRTThe Oscilloscope: Operation OscilloscopeOscilloscope Operation (X vs Y mode)An oscilloscope can be used to measure voltage. It does this by measuring the voltage dropacross a resistor and in the process draws a small current. The voltage drop is amplified andused to deflect an electron beam in either the X (horizontal) or Y (vertical) axis using anelectric field. The electron beam creates a bright dot on the face of the Cathode Ray Tube(CRT) where it hits the phosphorous.
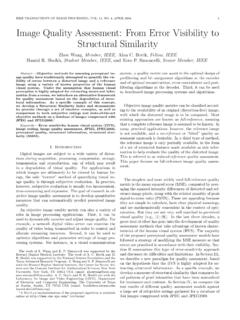
2 The deflection, due to an applied voltage, can bemeasured with the aid of the calibrated lines on the we will consider the circuitry that amplifies and conditions the voltage to be measured (the Amp block in figure 1).The deflection of the oscilloscope beam is proportional to the input voltage (after ac or dccoupling). The amount of deflection (Volts/Division) depends upon the setting of theAMPL/DIV control for that channel (see figure 2). The input signal can be ac or dc coupled. Ac coupling involves adding a series capacitor.
3 Thishas the effect of blocking (removing) the dc bias and low frequency components of a signal. Dc coupling does not have this problem and therefore allows you to measure voltages rightdown to 0 Hz. Ac coupling is useful when you are trying to measure a small ac voltage that is on-top of a large dc voltage. A typical example is trying to measure the noise of a dc powersupply. 2009 E&CE Dept. University of Waterloo page-2 Figure 2. Amplifier Block DiagramAmplifier FeaturesAMPL/DIV - This abbreviated name varies but it is generally some short form of amplitudeper division.
4 The control is a simple voltage divider (attenuator) which is used to change thesensitivity of the oscilloscope. At a 1 volt/DIV setting, a deflection of one major division onthe graticule represents a one volt change at the oscilloscope input. Calibrated voltage measurementsThe small knob within the AMPL/DIV control must be rotated clockwise into its detenteposition for the amplifiers to be calibrated. Otherwise the voltage/division will be someunknown value greater than what the dial indicates. INV - There is almost always a control which lets you invert one channel.
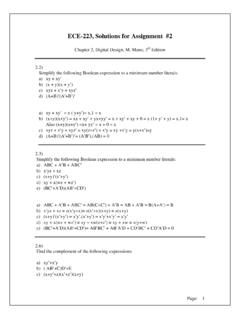
5 This can be usedalong with the ADD function to subtract two voltages. This is necessary because the commoninput (black lead of the oscilloscope cable) can only be connected to a 0V node. If channel Ahas V1 + V2 and channel B has voltage V1 then the reading of channel A + (-channel B) = (V1+ V2) + (-V1) = V2 Position - For each axis there is a control which lets you shift the electron beam. With this youcan set the zero voltage point to anywhere that is convenient for InputsThe input of the oscilloscope can usually be modelled as a resistance and a parallel capacitance(see figure 3).
6 The resistance is usually 1MS but it and the capacitance can vary greatly. Thetotal or effective capacitance includes the oscilloscope circuitry (approx. 30 pF), cables(approx. 30 pF/m) and stray capacitance. The resistance will draw current from the circuit whilethe capacitance will add an RC time constant with its associated time delay, frequency responseand distortion of some waveforms. The common connection (black lead or shield) at the input of the oscilloscope goes to the metalcase as the symbol by the input connector shows.
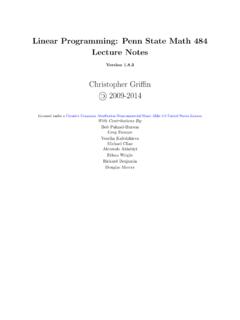
7 Because of this, the common input can onlybe connected to a 0V point in the circuit. Since the common inputs for both the A and Bchannels are connected to the case, they are effectively shorted together. 2009 E&CE Dept. University of Waterloo page-3 Figure 3. DC-coupled Oscilloscope Input Circuit and Frequency ResponseFigure 4. AC-coupled Oscilloscope Input Circuit andFrequency ResponseFrequency response is calculated or measured by applying a pure sinusoidal waveform to acircuit. The circuit response is the output voltage divided by the input voltage.
8 This is acomplex number that can also be expressed as a magnitude (gain) and to limitations in the amplifiers, the oscilloscope's frequency response is limited. Themanufacturer simply lists the half-power point for the oscilloscope without any external power is also called the -3dB point. At this point, the voltage has decreased to of itsmaximum. This means that only one-half of the maximum power would be dissipated in aresistive load. Keep in mind that an oscilloscope that is rated at 20 MHz is usually only accurateto 4 MHz for non-sinusoidal waveforms before distortion becomes a problem.
9 With ac coupling (figure 4), an oscilloscope has another series RC circuit. It acts like a highpass filter (HPF). If you are viewing low frequency signals when ac coupled, not only will younot be able to measure any dc offset, but you will also be removing some low Operation (Voltage vs Time)The main function of an oscilloscope is to show voltage vs time. This is done by applying aramp (or sawtooth) waveform into the X-axis amplifier as shown in figure 5. During the risingedge of the ramp, the electron beam scans across the screen.
10 When the voltage drops back to0V, the beam is turned off and quickly goes back to its starting point. This is signified by athick line when the beam is on and a thin one when it is off (blanked).To obtain a stable picture on the CRT screen, the ramp waveform has to be in phase with thesignal that you want to observe. This is done with a triggering circuit. The triggering circuitallows the oscilloscope to draw repeatedly the same waveform over and over by identifying thesame point on a repetitive waveform. 2009 E&CE Dept.