Transcription of SCORE - European High Risk Chart
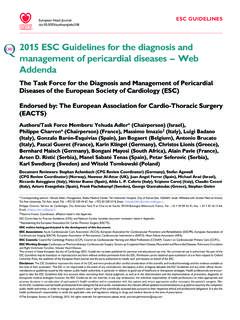
1 180160140120 WomenMenAge6560555040 Non-smokerSmoker789101255678334562233418 0160140120445673334522233112218016014012 0223341222311112111111801601401201112245 6781111101111001111801601401200000000000 0000000000131517192291012131667891145567 8910111356789345562334445567334452223311 2222233445678122231111211111000110000000 00000000 Cholesterol (mmol/L) 150 200 250 300mg/dL10 year risk of fatal CVD in high risk regions of Europe by gender, age, systolic blood pressure, total cholesterol and smoking statusSCORE - European High Risk Chart ESC 201815% and over10% - 14%5% - 9%3% - 4%2%1%< 1%10-year risk offatal CVD inpopulations athigh CVD riskSCORE2 Non-smokerSmoker141619222691113151668911 1345679911131518769101245679334567810124 5678334562233444567456782334522233112221 1122111110111100111263035414718212529341 3151720249101214171821242833121417202481 0121417678101212131619228911131656891144 5687810121445678567810345672334522334122 2311122111116 Systolic blood pressure (mmHg)How do I use the SCORE charts to assess CVDrisk in asymptomatic persons?
2 1. Use the low risk charts in Andorra, Austria, Belgium*, Cyprus, Denmark, Finland, France, Germany, Greece*, Iceland, Ireland, Israel, Italy, Luxembourg, Malta, Monaco, The Netherlands*, Norway, Portugal, San Marino, Slovenia, Spain*, Sweden*, Switzerland and the United the high risk charts in other European these, some are at very high risk and the charts mayunderestimate risk in these. These include Albania, Algeria, Armenia, Azerbaijan, Belarus, Bulgaria, Egypt, Georgia, Kazakhstan, Kyrgyzstan, Latvia, FYR Macedonia, Moldova, Russian Federation, Syrian Arab Republic, Tajikistan,Turkmenistan, Ukraine and Uzbekistan.*Updated, re-calibrated charts are now available for Belgium, Germany, Greece, The Netherlands, Spain, Sweden and Find the cell nearest to the person s age, cholesterol and BP values, bearing in mind that risk will be higher as the person approaches the next age, cholesterol or BP Check the qualifiers4.
3 Establish the total 10 year risk for fatal estimation using SCORE : Qualifiers The charts should be used in the light of the clinician s knowledge and judgement, especially with regard to local conditions. As with all risk estimation systems, risk will be over-estimated in countries with a falling CVD mortality rate, and under estimated if it is rising. At any given age, risk appears lower for women than men. However, inspection of the charts shows that their risk is merely deferred by 10 years, with a 60 year old woman resembling a 50 year old man in terms of risk. Risk may be higher than indicated in the Chart in: - Sedentary or obese subjects, especially those with central obesity - Those with a strong family history of premature CVD - Socially deprived individuals and those from some ethnic minorities - Individuals with diabetes- the SCORE charts should only be used in those with type 1 diabetes without target-organ damage; Other diabetic subjects are already at high to very high risk.
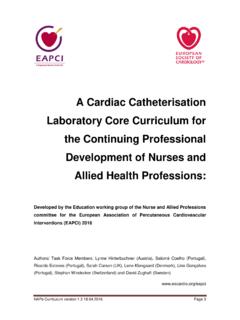
4 - Those with low HDL cholesterol* or increased triglyceride, fibrinogen, apoB, Lp(a) levels and perhaps increased high-sensitivity CRP. - Asymptomatic subjects with evidence of pre-clinical atherosclerosis, for example plaque on ultrasonography. - Those with moderate to severe chronic kidney disease (GFR <60 mL/ m2)*Note that HDL cholesterol impacts on risk in both sexes, at all ages, and at all level of risk. This effect can be estimated using the electronic version of SCORE , HeartScore, which has been updated to include HDL cholesterol : European Guidelines on CVD Prevention in Clinical Practice 2016 Eur J Prev Cardiol. 2016 Jul;23(11):NP1-NP96. doi: For the interactive version of the SCORE risk charts Systolic Blood Pressure (mmHg)Cholesterol (mmol/L)Non-SmokerSmoker1801601401203345 6233441222311122678101245678334562233445 67845678 ESC 2018 Relative Risk ChartsNote that a low total cardiovascular risk in a young person may conceal a high relative risk; this may be explained to the person by using the relative risk Chart .
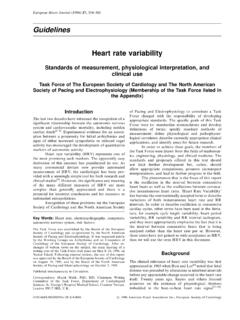
5 As the person ages, a high relative risk will translate into a high total risk. More intensive lifestyle advice will be needed in such persons. This Chart refers to relative risk, not percentage risk, so that a person in the top right corner is at 12 times higher risk than a person in the bottom left approach to explaining risk to younger persons is to use cardiovascular risk age. For example, in the high risk Chart , a 40 year old male hypertensive smoker has a risk of 4%, which is the same as a 65 year old with no risk factors, so that his risk age is 65. This can be reduced by reducing his risk year risk of fatal CVD in low risk regions of Europe by gender, age, systolic blood pressure, total cholesterol and smoking statusSCORE - European Low Risk Chart45667334452223311222333442222311122 1111112221111111111001111111100111000000 0000000000000000000000009911121466781044 5673334455678344552233412223333442223311 1221111111222111111111100011000000000000 000000001 WomenMenAge6560555040 Non-smokerSmokerCholesterol (mmol/L) 150 200 250 300mg/dL15% and over10% - 14%5% - 9%3% - 4%2%1%< 1%10-year risk offatal CVD inpopulations atlow CVD riskSCORENon-smokerSmoker180160140120180 1601401201801601401201801601401204567818 016014012045678 ESC 20184567845678 Systolic blood pressure (mmHg)How do I use the SCORE charts to assess CVDrisk in asymptomatic persons?
6 1. Use the low risk charts in Andorra, Austria, Belgium*, Cyprus, Denmark, Finland, France, Germany, Greece*, Iceland, Ireland, Israel, Italy, Luxembourg, Malta, Monaco, The Netherlands*, Norway, Portugal, San Marino, Slovenia, Spain*, Sweden*, Switzerland and the United the high risk charts in other European these, some are at very high risk and the charts mayunderestimate risk in these. These include Albania, Algeria, Armenia, Azerbaijan, Belarus, Bulgaria, Egypt, Georgia, Kazakhstan, Kyrgyzstan, Latvia, FYR Macedonia, Moldova, Russian Federation, Syrian Arab Republic, Tajikistan,Turkmenistan, Ukraine and Uzbekistan.*Updated, re-calibrated charts are now available for Belgium, Germany, Greece, The Netherlands, Spain, Sweden and Find the cell nearest to the person s age, cholesterol and BP values, bearing in mind that risk will be higher as the person approaches the next age, cholesterol or BP Check the qualifiers4.
7 Establish the total 10 year risk for fatal estimation using SCORE : Qualifiers The charts should be used in the light of the clinician s knowledge and judgement, especially with regard to local conditions. As with all risk estimation systems, risk will be over-estimated in countries with a falling CVD mortality rate, and under estimated if it is rising. At any given age, risk appears lower for women than men. However, inspection of the charts shows that their risk is merely deferred by 10 years, with a 60 year old woman resembling a 50 year old man in terms of risk. Risk may be higher than indicated in the Chart in: - Sedentary or obese subjects, especially those with central obesity - Those with a strong family history of premature CVD - Socially deprived individuals and those from some ethnic minorities - Individuals with diabetes- the SCORE charts should only be used in those with type 1 diabetes without target-organ damage; Other diabetic subjects are already at high to very high risk - Those with low HDL cholesterol* or increased triglyceride, fibrinogen, apoB, Lp(a) levels and perhaps increased high-sensitivity CRP.
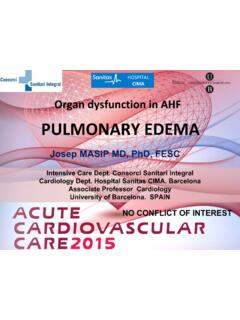
8 - Asymptomatic subjects with evidence of pre-clinical atherosclerosis, for example plaque on ultrasonography. - Those with moderate to severe chronic kidney disease (GFR <60 mL/ m2)*Note that HDL cholesterol impacts on risk in both sexes, at all ages, and at all level of risk. This effect can be estimated using the electronic version of SCORE , HeartScore, which has been updated to include HDL cholesterol Blood Pressure (mmHg)Cholesterol (mmol/L)Non-SmokerSmoker1801601401203345 6233441222311122678101245678334562233445 67845678 ESC 2018 Relative Risk ChartsNote that a low total cardiovascular risk in a young person may conceal a high relative risk; this may be explained to the person by using the relative risk Chart . As the person ages, a high relative risk will translate into a high total risk. More intensive lifestyle advice will be needed in such persons. This Chart refers to relative risk, not percentage risk, so that a person in the top right corner is at 12 times higher risk than a person in the bottom left approach to explaining risk to younger persons is to use cardiovascular risk age.
9 For example, in the high risk Chart , a 40 year old male hypertensive smoker has a risk of 4%, which is the same as a 65 year old with no risk factors, so that his risk age is 65. This can be reduced by reducing his risk : European Guidelines on CVD Prevention in Clinical Practice 2016 Eur J Prev Cardiol. 2016 Jul;23(11):NP1-NP96. doi: For the interactive version of the SCORE risk charts 8910121456781044567233455678943556233442 2233445622334122231112222334112221111211 1110111100011000000000015172023261012141 6197891113556891011131518789111355679344 5667810124567833456223344456723345222331 1222111221111101111000113