Transcription of SCOTIABANK’S FORECAST TABLES Canadian Growth …
1 1 March 6, 2018 GLOBAL ECONOMICS | SCOTIABANK S FORECAST TABLES Visit our web site at or contact us by email at CONTACTS Jean-Fran ois Perrault, SVP & Chief Economist Scotiabank Economics Solid Fundamentals, Exceptional Policy Uncertainty This update takes place amid exceptional policy-induced uncertainty. The fundamental drivers of Growth remain solid across the globe, with the expansion continuing to be remarkably synchronized and mutually reinforcing. While this dynamic provides broad-based protection against risks in any one country, it also highlights the vulnerability to the escalating trade rhetoric in Washington, and the possible global response to it. At the time of printing, details of the White House s proposed tariffs on steel and aluminum have not yet been released and so we have not incorporated them into this FORECAST .
2 We remain hopeful that sound economic reasoning will prevail and that the US administration will refrain from implementing measures that could dramatically alter the course of the US and global economy. If the US does proceed with these measures, we will fully reflect these developments in our Growth , policy rate and foreign exchange forecasts in April. For immediate reference, our February 2nd piece NAFTA: The Macroeconomic Consequences of Disruption examines a simplified case in which a trade war breaks out between the US and all its trading partners but Canada. It implies bleak consequences for the US. Abstracting from trade risks, the global Growth outlook has, in fact, continued improving, largely on account of US tax reform and increases in government spending.
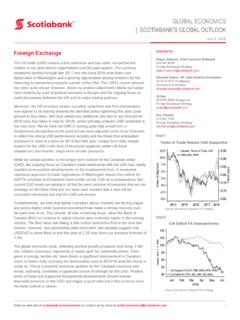
3 Though these policies will significantly raise US Federal deficits and debt, as well as increase the likelihood of a boom-and-bust scenario in the broader US economy, the immediate impact of these policies is to raise significantly both demand and output. The combined impact of the fiscal measures adds roughly half a percentage point to US Growth this year and next (chart 1), with Growth falling sharply in 2020 and 2021. This near-term boost comes at a significant fiscal cost, with the US federal deficit rising to more than a trillion dollars next year. In Canada, the US fiscal measures should largely benefit us in the near-term. Stronger US demand implies stronger Canadian export Growth , and we have revised our FORECAST accordingly. We now anticipate Canadian Growth will be this year, slowing slightly below 2% in 2019 (chart 1, again).
4 The Federal budget was a non-event from a short-term macroeconomic perspective. NAFTA-related uncertainty likely remains a drag on business activity in Canada, and we have maintained our view that this shaves about percentage points from Canadian Growth this year. Other uncertainties may compound the trade-related concerns of the business community: the loss of tax competitiveness with the US, relative changes in the countries regulatory regimes, and increases in provincial minimum wages. Owing to these factors, business investment in Canada is likely to be much weaker than would normally be implied by the strength of the global economy, the low cost of capital, and long-standing capacity pressures. In both this year and next, Canadian Growth will lag that in the US by about 1/3 of a percentage point.
5 Nevertheless, Canadian Growth is set to remain well above potential and price pressures abound: we continue to believe the Bank of Canada will Chart 1 , 2018US, 2019 Canada,2018 Canada,2019 Fiscal Impact on Real GDP Growth %Source: Scotiabank StimulusTax StimulusUnderlying growth2 March 6, 2018 GLOBAL ECONOMICS | SCOTIABANK S FORECAST TABLES Visit our web site at or contact us by email at raise rates by another 50 basis points this year based on domestic fundamentals. For the moment, we are sticking with our call that the next move will be in May, though the odds of that are decreasing given mounting trade-related uncertainties. We will re-evaluate this in our April 2018 Q2 Global Outlook in light of any announcements made on the trade side.
6 We very much consider this to be a caretaker FORECAST , with a high likelihood of significant revisions if the Trump Administration launches the first move in what could become a series of tit-for-tat trade measures with some of its closest allies. President Trump and his advisors appear to anticipate that countries will not respond to any US tariff increases, and that additional tariffs would be imposed by the US if countries do indeed retaliate. While steel and aluminum represent reasonably small segments of the global economy, the increase in uncertainty prompted by new tariffs would amplify the first round effects of any possible increase in protectionism as businesses and households ponder which industries may be next. The knock-on effects on the global economy could be substantial.
7 3 March 6, 2018 GLOBAL ECONOMICS | SCOTIABANK S FORECAST TABLES Visit our web site at or contact us by email at International2000 16201620172018f2019f2000 16201620172018f2019f World (based on purchasing power parity) United United Euro South Oil (USD/bbl)6343515760 Brent Oil (USD/bbl)6645556265 Nymex Natural Gas (USD/mmbtu) (USD/lb) (USD/lb) (USD/lb) (USD/lb) Ore (USD/tonne)6758726060 Metallurgical Coal (USD/tonne)127114187170150 Gold, London PM Fix (USD/oz)8691,2511,2571,3001,300 Sources: Scotiabank Economics, Statistics Canada, BEA, BLS, IMF, Bloomberg. (annual average) (annual % change)Real GDPC onsumer Prices(y/y % change, year-end)4 March 6, 2018 GLOBAL ECONOMICS | SCOTIABANK S FORECAST TABLES Visit our web site at or contact us by email at Quarterly ForecastsCanadaQ3Q4Q1fQ2fQ3fQ4fQ1fQ2fQ3f Q4fReal GDP (q/q ann.)
8 % change) GDP (y/y % change) prices (y/y % change) of new core CPIs (y/y % change) StatesReal GDP (q/q ann. % change) GDP (y/y % change) prices (y/y % change) ex. food & energy (y/y % change) : Scotiabank Economics, Statistics Canada, BEA, BLS, America2000 16201620172018f2019f2000 16201620172018f2019fReal Consumer Residential Business price index (CPI) ex. food & corporate rate (%) account balance (CAD, USD bn) trade balance (CAD, USD bn) budget balance* (FY, CAD, USD bn) ,085 percent of starts (000s, mn) vehicle sales (000s, mn)1,6571,9492,0412,0001, price index (year-end) account balance (USD bn) trade balance (USD bn) : Scotiabank Economics, Statistics Canada, CMHC, BEA, BLS, Bloomberg.
9 * Canada federal deficit ex risk adjustment of $ for FY19. (annual % change)Canada(annual % change, unless noted)United States(annual % change, unless noted)Mexico5 March 6, 2018 GLOBAL ECONOMICS | SCOTIABANK S FORECAST TABLES Visit our web site at or contact us by email at 2017 Central Bank RatesQ4Q1fQ2fQ3fQ4fQ1fQ2fQ3fQ4fAmericasB ank of Federal Reserve (upper bound) of Bank of of the Republic of Reserve Bank of Bank of Central of Bank of of 's Bank of Bank of of of and Interest RatesAmericasCanadian Dollar (USDCAD) Dollar (CADUSD) Peso (USDMXN) Real (USDBRL) Peso (USDCOP)2,9862,8002,9002,9002,9002,9502, 9503,0003,050 Peruvian Nuevo Sol (USDPEN) Peso (USDCLP)615597598597596593591588586 EuropeEuro (EURUSD) Pound (GBPUSD) Yen (USDJPY)
10 113114114115115118118120120 Australian Dollar (AUDUSD) Yuan (USDCNY) Rupee (USDINR) Korean Won (USDKRW)1,0671,0601,0601,0401,0401,0301, 0301,0201,020 Thai Baht (USDTHB) (Yields, %)3-month States (Yields, %)3-month : Scotiabank Economics, (end of period)(%, end of period)20186 March 6, 2018 GLOBAL ECONOMICS | SCOTIABANK S FORECAST TABLES Visit our web site at or contact us by email at The Provinces Real GDPCANLPENSNBQCONMBSKABBC2000 GDP2000 Rate (%)2000 Starts (units, 000s)2000 Vehicle Sales (units, 000s)2000 161,6572964838413635474521618020161,9493 395444458807555122021820172,041339594245 384762562452352018f2,0003285840445821615 62482312019f1,95030856394347916056250226 Budget Balances, Fiscal Year Ending March 31 (CAD mn)