Transcription of Scottish Index of Multiple Deprivation 2020
1 Scottish Index of Multiple Deprivation 2020 ToolkitPlanning Information and Delivery TeamSIMD ToolkitContents1. Toolkit Purpose2. Resources3. What is SIMD?4. How can I use SIMD?5. data Zones6. Components of SIMD7. Relative Ranking8. Describing SIMD9. Using Quintiles, Deciles and Vigintiles10. Local and National Share11. Presenting Findings12. ResourcesToolkit PurposeThe purpose of this tool kit is to provide individuals with the skills to use and analyse the Scottish Index of Multiple Deprivation (SIMD) data for their own areas of it will provide a brief overview of what SIMD is, a more detailed explanation of the data sets can be accessed through the resources is SIMD?The Scottish Index of Multiple Deprivation (SIMD) is a relative measure of Deprivation across 6,976 small areas (called data zones). If an area is identified as deprived , this can relate to people having a low income, but it can also mean fewer resources or opportunities.
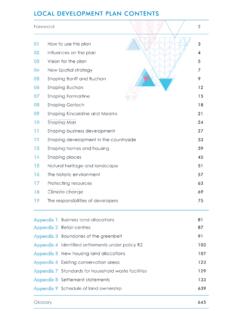
2 SIMD looks at the extent to which an area is deprived across seven domains: income, employment, education, health, access to services, crime, and zones are ranked for each domain from 1, being the most deprived area in Scotland, to 6,976, being the least deprived in Scotland. The impact of each domain to the overall ranking is weighted, based on how it contributes to Deprivation , with employment and income weighted the most heavily. This provides a relative measure of Deprivation at data zone level, and a ranking for each individual Zone Ranking16,976 Least DeprivedMost Deprived3,488 Overall DeprivationIncomeEducationHealthAccessCr imeHousingEmploymentHow can I use SIMD?Use SIMD for: Comparing overall Deprivation of small areas Comparing the seven domains of Deprivation Comparing the proportion of small areas in a council that are very deprived Finding areas where many people experience Multiple Deprivation Finding areas of greater need for support and interventionDo not use SIMD for.
3 Saying how much more deprived one area is from another -the difference between two ranks can be tiny or large Comparing ranks over time - changes are relative and may not reflect actual changes in the neighbourhood Comparing with other UK countries - each country measures Deprivation slightly differently Identifying all people who are deprived in Scotland - not everyone who is deprived lives in a deprived area Finding affluent areas - lack of Deprivation is not the same as being richData zonesData zones are the key geography for the dissemination of small area statistics in Scotland and are widely used across the public and private sector. They are designed to have roughly standard populations of 500 to 1,000 household residents, nest within Local Authorities, have compact shapes that respect physical boundaries where possible, and to contain households with similar social characteristics.
4 There are 6,976 data zones in Scotland and 340 data zones in Aberdeenshire. Components of SIMDT here are two elements to the SIMD data ; the ranking provided overall and for each of the seven domains, and the underlying indicator data that helps form the ranking. IncomeEducationHealthAccessCrimeHousingE mploymentPercentage of people who are employment deprivedNumber of people who are employment deprivedPercentage of people who are income deprivedNumber of people who are income deprivedComparative Illness Factor: standardised ratioHospital stays related to alcohol or drug use: standardised ratioStandardised mortality ratioProportion of population being prescribed drugs for anxiety, depression or psychosisProportion of live singleton births of low birth weightEmergency stays in hospital: standardised ratioAverage drive time to a petrol station, GP surgery, post office, primary school, retail centre or secondary school in minutesAverage public transport time to GP surgery, post office of retail centre in minutes% of Premises without access to superfast broadbandNumber of recorded crimes of violence, sexual offences, domestic housebreaking, vandalism, drugs offences, and common assaultRecorded crimes of violence, sexual offences, domestic housebreaking, vandalism, drugs offences, and common assault per 10,000 peopleNumber of people in households that are overcrowdedNumber of people in households without central heatingPercentage of people in households that are overcrowded Percentage of people in households without central heating School pupil attendanceAttainment of school leaversWorking age people with no qualifications.
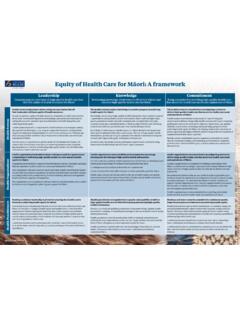
5 Standardised ratioProportion of people aged 16-19 not participating in education, employment or trainingProportion of people aged 16-19 not participating in education, employment or trainingRelative RankingFor overall Deprivation and for each individual domain SIMD ranks every data zone in Scotland from 1, the most deprived area to 6,976, the least deprived area. This provides a relative ranking of data zones. to understand this better let us look at a group of 6 individuals and their respective ages:Relative RankingIf we rank them in order of youngest to oldest, we can tell their relative age person b is younger than person c and older than person a . This is what the SIMD ranking tells you cannot tell from relative ranking is how much difference in age there are between the members in our group. This is the same for SIMD, you only know the relative position of a data zone, not how much difference there is between of this ranking measure you also cannot use SIMD to monitor change over time in an area.
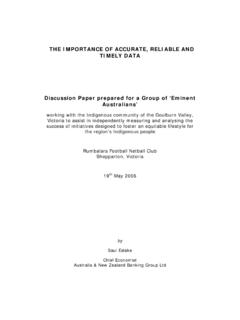
6 It is a snapshot of the current situation. While the ranking of a data zone may change between data releases this does not necessarily translate to material changes on the ground. It may be that other areas have worsened or improved. Describing SIMDI nstead of the number ranking (1 to 6,976) the easiest way to think about the SIMD score of a data zone is in percentage groupings Quintiles split the data zones into 5 groups, each containing 20% of Scotland s data zones Deciles split the data zones into 10 groups, each containing 10% of Scotland s data zones Vigintiles split the data zones into 20 groups, each containing 5% of Scotland s data zonesYou can describe data zones as falling into one of these groupings within the 20% most deprived in Scotland. Some examples on how to use these can be found on the following pages. While this guidance focuses on overall Deprivation ranking the same principles can be applied to any of the individual domains.
7 Describing SIMDV igintilesQuintilesDecilesUsing Quintiles, Deciles and VigintilesMost DeprivedQuintiles, deciles and vigintiles all work in the same way, it is only the level of detail provided that changes. Which you select to use will depend on the purposes of the data and how big an area you are looking at. Typically, research focuses on identifying the most deprived example, data zone S01013306 has an overall ranking of 340, therefore is the 340th lowest ranking data zone in Scotland. Looking at each of our 3 division you could describe it as: In the 1st quintile therefore within the 20% most deprived in Scotland In the 1st decile therefore within the 10% most deprived in Scotland In the 1st vigintile therefore within the 5% most deprived in ScotlandThe % Look-up tab in the Aberdeenshire SIMD 2020 Rankings spreadsheet will help you quickly identify the quintiles, deciles and vigintiles for each for data zone Deprived You may also want to look at the other end of the scale.
8 For example, data zone S01006982 is ranked at 6,008, found in the 18thvigintile. While you can describe it as being in the 90% most deprived in Scotland, it is probably more meaningful to talk about it being the 20% least deprived. Remember you can only talk about most and least levels of Quintiles, Deciles and VigintilesIt is up to the data user how they wish to describe the figures in terms of most and least Deprivation however at the halfway point in the rankings is a typical place to switch terminology. Further Examples The following examples are all looking at vigintiles, although the same principles can be used in quintiles and decilesUsing Quintiles, Deciles and VigintilesData zone RankingVigintile%Description702311 - 15%Within the 15% Most Deprived in Scotland1,555921 - 25%Within the 25% Most Deprived in Scotland2,933941 - 45%Within the 45% Most Deprived in Scotland4,1121256 60%Within the 45% Least Deprived in Scotland4,7991466 70%Within the 35% Least Deprived in Scotland6,8322096 100%Within the 5% Least Deprived in ScotlandLocal and National ShareAberdeenshire ExampleWhile it can be useful to discuss individual data zones what is more usual is to be looking at overall Deprivation levels within a larger area.
9 Remember while data zones fit into local authority boundaries, other areas such as settlements or wards do not have always align and therefore you may need to consider a best fit cannot amalgamate SIMD rankings to provide an overall or average score for an area. Instead we look at the local share of Deprivation . There are 340 data zones in Aberdeenshire 9 are within the 20% most deprived in Scotland Therefore of Aberdeenshire s data zones are in the most deprived 20% in Scotland. This is the local share of Deprivation There are 1,395 data zones in Scotland in the 20% most deprived of these are in Aberdeenshire. This is the national share of deprivationWhich percentage groupings you choose to describe the area will depend on the data . You may be looking at most or least Deprivation or a and National ShareFurther ExamplesBelow are some further examples of using SIMD to describe an area.
10 Area: FraserburghNo of data zones: 17 Quintile% GroupingNumber of data zonesLocal Share11% - 20% 40% 60% 80% 100% can therefore say that in Fraserburgh of the area s data zones are in the 20% most deprived in Scotland, with being in the least deprived 20%. Local and National ShareFurther ExamplesBelow are some further examples of using SIMD to describe an area. Area: EllonNo of data zones 14 Quintile% GroupingNumber of data zonesLocal Share11% - 20%00%221% 40%00%341% 60% 80% 100% of Ellon s data zones can considered within the 40% most deprived in Scotland. of the area is within the 20% least deprived in your FindingsThere are many different and creative ways you can display SIMD figures. Graphs or pictorial representations of data often best help the reader understand and visualize key messages you are trying to communicate.