Transcription of Seasonal Adjustment for Short Time Series in Excel
1 Seasonal Adjustment for Short time Series in Excel . Catherine Hood Catherine Hood Consulting The minimum length to seasonally adjust a time Series in X-12-ARIMA is four years. So what can we do if we have a time Series that is shorter than four years long? Seasonal Adjustment can be difficult under the following conditions: The trend is not approximated by a straight line. Trading day and moving holiday regressors are present. Outliers (level shifts or point outliers) are present. Fortunately for us, if we have a Short Series that is fairly well-approximated by a straight line, and if we don't need to estimate trading day, moving holidays, or outliers, then we can do a simple Seasonal Adjustment in Excel . The good news is that for Short Series , we probably can estimate the trend fairly well with a straight line. With only a few data points for a particular month or quarter, we don't have enough data to estimate trading day or moving holiday effects anyway, so we won't try to estimate them.
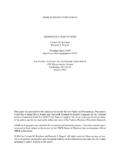
2 It may be possible to estimate outlier effects, but I will not cover that in this paper. Below I've outlined the steps, with examples, for seasonally adjusting Short Series in Excel . I will start with the simplest case and move to more complicated cases. Case 1 A Quarterly Series with a Flat Trend 950. 900. 850. 800. 750. 700. 650. 600. 550. 500. 1 2 3 4 5 6 7 8 9 10 11 12. If the trend is flat, then we can use the average for the Series as the trend. An example Series that is three years long is shown in the graph above. The values for this Series are in the table below. Steps to calculate the Seasonal Adjustment : 1. Calculate the average for the Series . In the example Series , the average is 753, so we will use this for our trend. 2. Calculate the difference between the original Series and the trend. I've labeled this as "residual". in the table below. For example, for Quarter 1, 1991, we have 864 753 = 111.
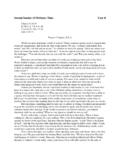
3 3. Calculate the Seasonal factors (SF), which are the average of the residuals for a given quarter. (Note: I usually calculate the averages once and then paste the values for the other years.) For example, the Seasonal factors for all the Quarter 1 values will be (111+87+145) / 3 = , for all the Quarter 2 values will be (-57 + -42 + -49) / 3 = , and so on. 4. Subtract the Seasonal factor from the original Series to get the seasonally adjusted Series . For example, for Quarter 1, 1991, we have 864 = Original Trend residual SF SA Series 1991 1 864 753 111 1991 2 696 753 -57 1991 3 603 753 -150 1991 4 828 753 75 1992 1 840 753 87 1992 2 711 753 -42 1992 3 594 753 -159 1992 4 822 753 69 1993 1 898 753 145 1993 2 704 753 -49 1993 3 631 753 -122 1993 4 845 753 92 950. 900. 850. 800. 750. 700. 650. 600. 550. 500. 1 2 3 4 5 6 7 8 9 10 11 12. Series1 Trend Seas Adj Series Case 2 A Quarterly Series with an Increasing (or Decreasing) Trend Now we have a case where the trend is NOT flat, so we first have to estimate the trend that fits the data.
4 Once we have a trend, you will see that the rest of the calculations use the formulas we used in the previous example. This Series may also have the Seasonal fluctuations that depend on the level of the Series , though it's a bit unclear with such a Short Series . We will assume that the Seasonal fluctuations are steady for this Series , and we will discuss the issue of increasing/decreasing size of fluctuations in Case 3 below. 1500. 1400. 1300. 1200. 1100. 1000. 900. 800. 700. 600. 500. 1 2 3 4 5 6 7 8 9 10 11 12. The best way to estimate a straight-line trend through a Series like this is with a regression analysis. If you have never done regression in Excel before, you might not even find it as an option. The data analysis pack comes standard with Excel in Excel 97 , Excel 2003 , and Excel 2007 , but some versions of Excel don't install it unless you request it. If you look for data analysis and can't find it (it's under the "Data" tab in Excel 2007 ), then you will need to search the Help for "data analysis" and see what you need to do on your computer to install this group of routines.
5 Steps to calculate the Seasonal Adjustment : 1. Use regression analysis to find the trend line for the data. a. Select Data Analysis Regression. Select the original Series as the "y" variable and an index number (see the first column below) as the "x" variable. Part of the regression results are in the text box below. Standard Lower Upper Lower Upper Coefficients Error t Stat P-value 95% 95% Intercept X- Variable b. The only values from this output that we need are the coefficient values for both the "Intercept "and the "X Variable." The form of the trend line is y = Intercept + (X Variable)*index. For this Series , our trend line will be y = +. *index. 2. Calculate the trend using the equation from Step 1. For example, for Quarter 1, 1991 we have + *1 = , for Quarter 2, we have + *2 = , and so on. 3. As in Case 1, calculate the difference between the original Series and the trend to get the residual. 4.
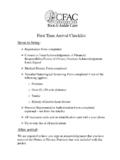
6 As in Case 1, calculate the Seasonal factors (SF) as the average of the residuals for a given quarter. 5. As in Case 1, subtract the Seasonal factor from the original Series to get the seasonally adjusted Series . Index # Original Trend residual SF SA Series 1 1991 1 1041 2 1991 2 835 3 1991 3 724 4 1991 4 992 5 1992 1 1176 6 1992 2 994 7 1992 3 834 8 1992 4 1152 9 1993 1 1437 10 1993 2 1126 11 1993 3 1010 12 1993 4 1351 1500. 1300. 1100. 900. 700. 500. 1 2 3 4 5 6 7 8 9 10 11 12. Series 2 Trend Seas Adj Series Case 3 A Monthly Series with Changes in the Variance This Series is three years from Midwest Total Housing Starts. Because we have more points in a monthly Series , I've only included the graph and not a table of values. As in the second example, the trend is not flat. In addition to this complication, we now have a monthly Series where the size of the Seasonal fluctuations depends on the level of the Series .
7 This second issue is quite common in economic time Series where the variation increases as the level increases (or in this case, decreases as the level decreases). When this happens, we need a variance-stabilizing transformation, and the logarithm works well for this. 30. 25. 20. 15. 10. 5. 0. 1 3 5 7 9 11 13 15 17 19 21 23 25 27 29 31 33 35 37. Steps to calculate the Seasonal Adjustment : 1. Take the logarithms of the original data. 2. Use regression analysis to find the trend line for the logged data. This time the y-variable will be the logged data, with the x-variable as the index number, as before. Again, we use the coefficient values for both the "Intercept "and the "X Variable." The form of the trend line is y = Intercept +. (X Variable)*index. 3. Calculate the logged trend using the equation from Step 2. 4. Calculate the difference between the logged original Series and the logged trend (from Step 3) to get the residual.
8 5. Calculate the Seasonal factors (SF) as the average of the residuals for a given month. 6. Subtract the Seasonal factor from the logged original Series to get the logged seasonally adjusted Series . 1. 0. 1 3 5 7 9 11 13 15 17 19 21 23 25 27 29 31 33 35 37. Log of Series3 Trend Log Seas Adj Series 7. To get back on the original scale, we take the logged seasonally adjusted Series and use it as a power of 10. 30. 25. 20. 15. 10. 5. 0. 1 3 5 7 9 11 13 15 17 19 21 23 25 27 29 31 33 35 37. Series3 Seas Adj Series Seasonal Adjustment for Longer Series Now that you've seen how simple it can be to compute Seasonal adjustments in Excel , you may be tempted to use Excel for Seasonal Adjustment of longer Series . However, you should resist this temptation. Many Seasonal Adjustment programs have built-in procedures to deal with many of the issues we see in Seasonal Adjustment . In particular, both X-12-ARIMA and TRAMO/SEATS have filters designed to estimate trends that contain cycles, a very common feature in time Series .
9 Both programs have procedures for trading day and moving holiday estimation, including user-defined regressors. Both programs are also designed to be robust against extreme values. Estimating trends, trading day, holidays, and extreme values is difficult when seasonality is present, and that is why Seasonal Adjustment software uses iteration to make more and more refined estimates of the various components of a Seasonal time Series . For more information on X-12-ARIMA, please visit The Census Bureau's X-12 site at My FAQ on X-12 at For more information on TRAMO/SEATS, please visit The Bank of Spain's site at My FAQ on TRAMO/SEATS at Note: All graphs in this paper were created in Excel . Trademarks and Copyrights TRAMO/SEATS is written by Victor Gomez and Agustin Maravall and is available free of charge from the Bank of Spain web site. X-12-ARIMA is a product of the Census Bureau and is available free of charge.
10 Excel is a registered trademark of Microsoft Corporation. Disclaimer There is no warranty with regard to the information provided above, and we assume no responsibility for any damage resulting from any use of any methods, products, instructions, or ideas contained in this paper.