Transcription of Section 1.4 – Graphs of Linear Inequalities
1 Math 1313 Page 1 of 21 Section Section Graphs of Linear Inequalities A Linear Inequality and its graph A Linear inequality has the same form as a Linear equation, except that the equal symbol is replaced with any one of , , <, or >. The solution set to an inequality in two variables is the set of all ordered pairs that satisfies the inequality, and is best represented by its graph . The graph of a Linear inequality is represented by a straight or dashed line and a shaded half-plane. An illustration is shown below. Example 1: Without graphing , determine whether ( 3,7) is a solution to 4yx>.
2 Solution: Substitute 3x= and 7y= into the inequality and determine if the resulting statement is true or false. 4?73 47yx> > >7 This statement 77 > is false, so the point ()3, 7 is not a solution to the inequality. ** Math 1313 Page 2 of 21 Section Example 2: Without graphing , determine whether ( 1, 1) is a solution to 2105xy+ . Solution: Substitute 1x= and 1y= into the inequality and determine if the resulting statement is true or false. ()( )2105?2110 15?2 1058 5xy+ + + This statement 8 5 is true, so the point ()1, 1 is a solution to the inequality.
3 ** graphing a Linear Inequality in Two Variables Next, we will graph Linear Inequalities in two variables. There are several steps, which are outlined below. Steps for graphing a Linear Inequality in Two Variables 1. Rewrite the inequality as an equation in order to graph the line. 2. Determine if the line should be solid or dashed. If the inequality symbol contains an equal sign ( or ), graph a solid line. If the inequality symbol does not contain an equal sign ( < or >), graph a dashed line. 3. Determine which portion of the plane should be shaded.
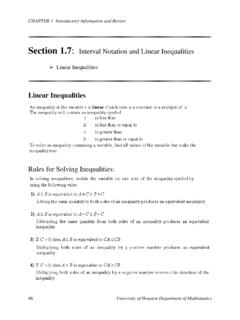
4 Choose a point not on the line, and plug it into the inequality. 4. If the test point satisfies the inequality, shade the half-plane containing this point. Otherwise, shade the other half-plane. Example 3: graph the inequality 24xy + . Solution: We first write the inequality as an equation, 24xy + =. The line will be graphed as a solid line because the inequality in this problem is , which includes the line. We can graph the line using x- and y-intercepts, or by putting it in slope-intercept form, ymx b=+. Math 1313 Page 3 of 21 Section We will choose to find the x- and y-intercepts of 24xy + =.
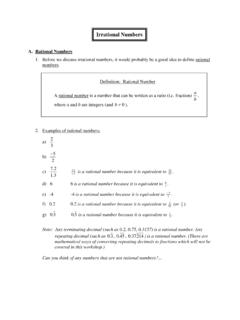
5 ( )24242042 042442xyxyxxyx + = + = + = + === A solid line is drawn through the intercepts, which are located at ( 2, 0) and (0, 4). We now need to determine which portion of the plane should be shaded. To do this, we choose any test point not on the line, and substitute those coordinates into the inequality to determine if the resulting statement is true. We will choose the point (0, 0). ( )24?2 00 40 4xy + + Since 0 4 is true, then (0, 0) satisfies the inequality, and so we shade the half-plane containing (0, 0).
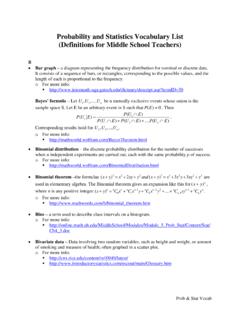
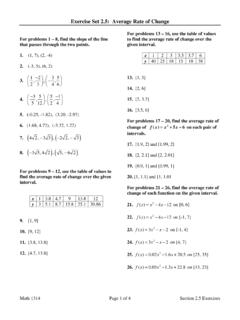
6 Math 1313 Page 4 of 21 Section The solution set is the half-plane lying on or below the line 24xy + =. ** Example 4: graph the inequality 3xy+ < . Solution: We first write the inequality as an equation, 3xy+ = . The line will be graphed as a dashed line because the inequality in this problem is <, which does not include the line. We can graph the line using x- and y-intercepts, or by putting it in slope-intercept form, ymx b=+. We will choose to find the x- and y-intercepts of 3xy+ = . 33030333xyxyxyxy+ = + = + = + = = = A dashed line is drawn through the intercepts, which are located at ( 3, 0) and (0,3).
7 We now need to determine which portion of the plane should be shaded. To do this, we choose any test point not on the line, and substitute those coordinates into the inequality to determine if the resulting statement is true. We will choose the point (0, 0). 30 0303xy+ < + < < Since 03< is not true, then (0, 0) does not satisfy the inequality, and so we shade the half-plane not containing (0, 0). Math 1313 Page 5 of 21 Section The solution set is the half-plane lying below the line 3xy+ = . ** There is a shortcut for graphing Inequalities without using test points, provided that the inequality is written in the form ymx b<+, ymx b +,ymx b>+, or ymx b +.
8 graphing Inequalities Without Using Test Points Inequality The solution is the half-plane lying: ymx b<+ below the line ymx b=+. ymx b + on or below the line ymx b=+. ymx b>+ above the line ymx b=+. ymx b + on or above the line ymx b=+. If we think about the meaning of the chart above, we can remember its information without memorization. To say that ymx b<+ means that for every value of x, the y-values of the solution are lower than the y-value of the line, and therefore the shading occurs below the line.
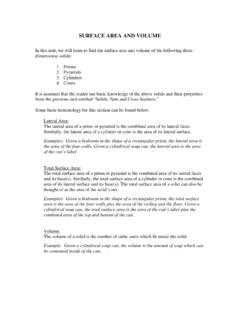
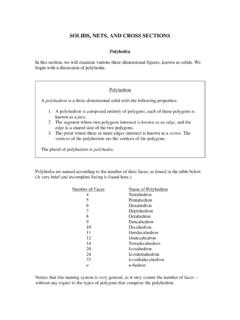
9 To say that ymx b>+ means that for every value of x, the y-values of the solution are higher than the y-value of the line, and therefore the shading occurs above the line. And as discussed in previous examples, an equals sign in the inequality means that the line is included in the solution. Example 5: graph the inequality 36yx +. Solution: We first write the inequality as an equation, 36yx=+. The line will be graphed as a solid line because the inequality in this problem is , which includes the line. We can graph the line using x- and y-intercepts, or by using the slope and y-intercept from slope-intercept form.
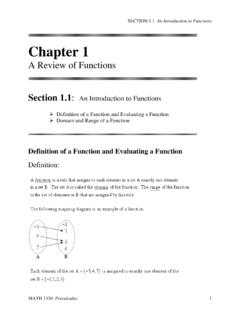
10 Math 1313 Page 6 of 21 Section We will choose to find the x- and y-intercepts of 36yx=+. ( )36360 363 063662yxyxxyxyx=+=+=+=+ === A solid line is drawn through the intercepts, which are located at ( 2, 0) and (0, 6). We can now use our shortcut rather than selecting a test point. Since the inequality is of the form 36yx +, we shade above the line. The solution set is the half-plane lying on or above the line 36yx=+. ** Example 6: graph the inequality 1239xy > . Solution: We first write the inequality as an equation, 1239xy =.