Transcription of Secular Stagnation: The Long View - The National …
1 NBER WORKING PAPER SERIES. Secular stagnation : THE long view . Barry Eichengreen Working Paper 20836. National BUREAU OF ECONOMIC RESEARCH. 1050 Massachusetts Avenue Cambridge, MA 02138. January 2015. Prepared for the ASSA Annual Meetings (Boston, January 2-5, 2015). I thank Joseph Root for careful research assistance. The views expressed herein are those of the author and do not necessarily reflect the views of the National Bureau of Economic Research. NBER working papers are circulated for discussion and comment purposes. They have not been peer- reviewed or been subject to the review by the NBER Board of Directors that accompanies official NBER publications. 2015 by Barry Eichengreen. All rights reserved. Short sections of text, not to exceed two paragraphs, may be quoted without explicit permission provided that full credit, including notice, is given to the source.
2 Secular stagnation : The long view Barry Eichengreen NBER Working Paper No. 20836. January 2015. JEL No. E00,N1. ABSTRACT. Four explanations for Secular stagnation are distinguished: a rise in global saving, slow population growth that makes investment less attractive, averse trends in technology and productivity growth, and a decline in the relative price of investment goods. A long view from economic history is most supportive of the last of these four views. Barry Eichengreen Department of Economics University of California, Berkeley 549 Evans Hall 3880. Berkeley, CA 94720-3880. and NBER. Secular stagnation : The long view Barry Eichengreen1. January 2015. What does history have to say about the dangers of Secular stagnation ? History doesn't actually say anything, but it points to observations, patterns, and discrepancies between past predictions and outcomes that may be helpful for formulating answers to such questions.
3 Historical investigation is complicated by competing definitions and hypotheses. Here I. define Secular stagnation as a downward tendency of the real interest rate, reflecting an excess of desired saving over desired investment, resulting in a persistent output gap and/or slow rate of economic growth. I distinguish four tendencies that might explain such a phenomenon: a rise in savings rates due to the emergence of emerging markets; a decline in investment rates due to reflecting a dearth of attractive investment opportunities, a decline in the relative price of investment goods, and a decline in the rate of population growth. Modern discussions of Secular stagnation point to the decline in real interest rates since 1980. Thus, two Bank of Canada researchers writing in 2006 (Brigitte Desroches and Michael Francis 2006) highlight the decline in long -term real interest rates in the G7 countries over the past 25 years.
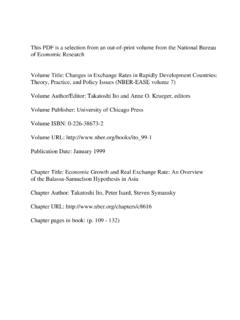
4 2 IMF (2014) observes that real interest rates worldwide have declined substantially since the 1980s. While there are hints that recent movements may, in part, reflect mean reversion (Desroches and Francis write of how real interest rates have declined to levels not seen since the 1960s ), there is little consideration of the long -term 1. Prepared for the ASSA Annual Meetings (Boston, January 2-4, 2015). I thank Joseph Root for careful research assistance. 2. Desroches and Francis infer inflation expectations by estimating an autoregressive process based on the historical behavior of inflation. The IMF estimates an autoregressive process using rolling windows and, alternatively, utilizes survey data. 3. Note however that Laubach and Williams (2003) extend the picture back to the 1960s. 1. Figure 1 shows nominal and real interest rates for the United States over the last two centuries: the yield on ten-year constant-maturity government bonds with and without adjustment for realized consumer price inflation, where the adjustment involves subtracting a seven-year moving average of CPI inflation (the current year and past six).
5 4 For much of the 19th century, when the was on the gold standard, the nominal interest rate may be more informative, insofar as inflation was a random walk with expectation The figure points to an alternative interpretation, namely that the decline in real interest rates starting in the 1980s is mean reversion after the exceptional period of high interest rates and inflation that preceded it. Turning to explanations, recent discussion highlighting the possibility of a rise in the global savings rate emphasizes high savings rates in emerging-market economies. This was of course the focus of Ben Bernanke's (2005) global savings glut hypothesis and Alan Greenspan's (2005) conundrum of anomalously low long -term interest rates (another incarnation of the same phenomenon considered here). Compared to the advanced economies, emerging markets are financially underdeveloped, forcing households to substitute brute-force accumulation for portfolio diversification.
6 The public sector provides little in the way of a social safety net, encouraging precautionary saving for contingencies and old age. Central banks and governments in emerging markets rely on reserve accumulation for insurance against financial shocks. In many cases, low old-age dependency ratios make for high levels of life-cycle savings. The implication is that as the share of global GDP accounted for by emerging markets has risen, so too have global savings rates. 4. For the portions of the 1830s and 1840s when there was no federal debt, New York State canal bonds are used. It makes very little difference to the picture when a five-year moving average is substituted and when the ex post real interest rate is displayed as a five- or seven-year moving average. 5. Some would argue that the price level was mean reverting under the gold standard that inflation should have given rise to expectations of subsequent deflation.
7 The empirical relevance of the argument is disputed by Summers (1983). 2. Modern analyses focus on the period since the mid-1990s, the first point in time when the vast majority of emerging markets and developing countries increased their output faster than the United States. But for some countries it is possible to consider longer intervals. Historians of the 19th-century United States ( Frank Lewis 1983), for example, have pointed to the country's high immigration and low old-age dependency rates as explanations for relatively high savings rates that allowed it, unlike other countries with extensive infrastructure needs, to meet these without relying extensively on foreign capital. This 19th century savings glut explains how it was that interest rates remained low despite pressure for capital deepening from biased technological change. Analysts of other countries, such as John Hobson (1909), were concerned in this period about the problem of underconsumption (read oversaving ), attributable to the increasing concentration of wealth and income in the hands of the 1 per cent.
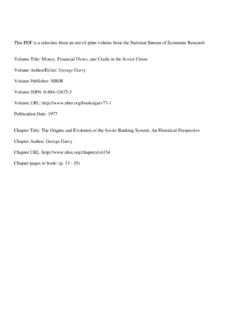
8 6. Figure 2 shows data on global savings rates from the early 20h century through 2013. The pre-1970 estimates are assembled from National sources. These are GDP weighted average across countries of domestic investment rates (using 2005 GDP in purchasing power parity terms).7 While there is some evidence of an upward trend over the long term (interrupted by the two world wars and the Great Depression), one has to look hard to see any evidence of a growing savings glut after 1980, as opposed to a temporary bulge in the period of high Chinese savings from the turn of the 21st century to the financial 6. Hobson pointed to imperialism and colonialism as creating an outlet for the resulting excess saving, analogous to how Hansen (1938) pointed to the end of the frontier era as closing off a vent for excess savings some 30 years later. 7. National savings rates are, of course, the sum of domestic investment and the current account balance, but current accounts sum to zero across countries (in principle if not always in the data).
9 The global current account discrepancy and gaps in country coverage mean that what is shown here is necessarily an approximation. Alternatively, the country data can be weighted by current year GDP in purchasing power parity terms from the Maddison data base. While these show basically the same pattern, data are available only for a subset of countries. 8. By limiting their analysis to the period since the early 1980s, Grigoli, Herman and Schmidt-Hebbel (2014) are able to consider a wider range of countries. Their evidence and conclusions are consistent with mine here. 3. Estimates of historical investment rates tend to derive from data on the output of investment-goods industries, and the further one goes back in time the more investment is likely to go through the informal sector or reflect household production (as with fencing, field clearing, swamp clearing and barn raising in the agricultural sector) and therefore be missed by such methods.
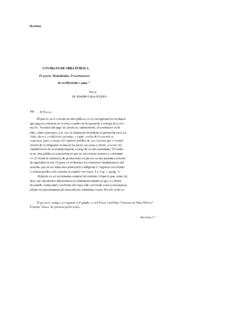
10 For a very few countries like the United States, historians have augmented the output of capital goods sectors with estimates of home manufacturing and the value of farm improvements made with farm materials in the 19th and early 20th centuries. Figure 3 shows the estimates of Robert Gallman (1966) spliced to the standard National accounts data since The in the 19th century displays the behavior familiar from 21st century emerging markets, with investment rates rising from 16 per cent in 1834-43 to 28 per cent in 1899-1908. Subsequently, savings rates headed back down. This is a hint as to what is likely to happen in emerging markets as populations age and capital/labor ratios approach equilibrium levels. It suggests that even if high global savings are a factor in current low real interest rates, they may not remain so indefinitely. A second popular explanation for the low level of real interest rates is a decline in the relative price of investment goods (think cheapening of personal computers).