Transcription of SENSORY ANALYSIS Section 5. - Virginia Tech
1 SENSORY ANALYSIS Section 5 Dr. Bruce W. Zoecklein 1 SENSORY ANALYSIS Section 5. Affective Test Methods Commonly-used affective methods include a paired preference test, a preference ranking test, and the hedonic test method (ASTM, 1968; Meilgaard et al., 1991; Stone and Sidel, 1985). The test method must be simple and easy to understand, so the consumers making up the panel will know how to respond. Paired Preference Test. Once a significant difference has been established between two wines, a preference test can be performed. This is useful in determining which wine blend or which yeast fermentation is preferred, for example.
2 It is important to note that a preference test should be performed separately and after a difference test. It may be tempting to combine the two, but this should be avoided, as results can be misleading. In determining preference, it is also important for the tasters to consider (and possibly discuss) the desired wine style required before tasting the wine. The preference decision should not be a personal preference, but a preference for the wine which best suits the desired wine style. SENSORY ANALYSIS Section 5 Dr. Bruce W. Zoecklein 2 These tests try to answer the question of which product is preferred, or how much the product is liked.
3 The panelists included in these tests should be users of the product. There is no need for panel training. Optimally, there should be more than 30 panelists. There are several types of preference and acceptance tests . A common one is the 9-point hedonic scale. The paired preference test is set up in the same manner as the paired comparison method for discrimination testing. Two samples are compared to determine which product is preferred. A large number of similar responses must be obtained to determine that one product is preferred more than the other. The minimum number of similar responses needed to determine if the preference is significant is based on the total number of responses obtained, and may be determined from a statistical table.
4 Ranking Test. If more than two samples are evaluated, a preference ranking test may be completed. Usually three to five samples are the most that can be efficiently ranked by a consumer. This test asks the consumer to order the samples based on preference, with a ranking of 1 meaning most preferred. Hedonic Test. The hedonic scale may be used to determine degree of acceptability of one or more products. This scale is a category-type scale with an odd number (five to nine) categories ranging from dislike extremely to like extremely. A neutral midpoint (neither like nor dislike) is included. Consumers rate the product on the scale based on their response.
5 SENSORY ANALYSIS Section 5 Dr. Bruce W. Zoecklein 3 Principal Component ANALYSIS (PCA) An advanced statistical method, principal component ANALYSIS is frequently used in the wine industry to illustrate relationships between a reduced set of variables. Patterns in descriptive SENSORY data may be determined by analyzing the data by this multivariate statistical method. The number of variables is reduced using factor ANALYSIS , such that the first principal component statistically identified explains most of the variability in the data (Meilgaard et al., 1991). The second component, which is not correlated with the first, explains the majority of the remaining variance.
6 Additional principal components may be identified, up to the number of observed variables, until no significant variability can be explained from extraction of another principal component. Usually there are only two or three principal components of value, because most of the variability will be explained in the first components that are extracted (Meilgaard et al., 1991). A graphic portrayal of principal component ANALYSIS attributes may be used to illustrate relationships among principal attributes of different wines. Primary and secondary principal components are presented as axes at right angles with each other (Meilgaard et al.)
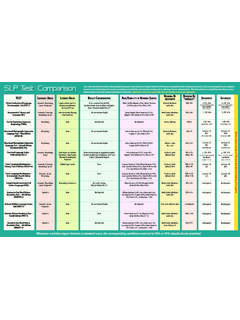
7 , 1991). The principal components for two wines are presented in Figure 1. Emanating from the central origin are vectors representing each attribute. The length of the vector may be interpreted as an indication of influence on that principal component. Short vectors indicate attributes of relatively low importance. Close alignment of a vector with the principal component axis indicates a high correlation between the attribute represented by the axis and the variability explained by the principal component. On this graphic representation, the principal component score of each wine is indicated as a point.
8 The location of SENSORY ANALYSIS Section 5 Dr. Bruce W. Zoecklein 4 this point in relation to the principal components and the vectors representing attributes can provide information about the wine. Figure 1. Example of a Principal Component ANALYSIS In the, two components explain 84% of the variance. The fruity aromas of raspberry and pear, and a geranium (floral) aroma, are closely correlated with component 1. Oak and earthy aroma descriptors are closely aligned with principal component 2. The cinnamon characteristic appears to have relatively low importance in explaining the variance in the data analyzed.
9 Oak and geranium aromas are high in wine 2, whereas wine 1 has some earthy and cinnamon aromas in moderate levels. SENSORY ANALYSIS Section 5 Dr. Bruce W. Zoecklein 5 Summary SENSORY evaluation in the wine industry is currently underutilized, but can provide many benefits to the winery that employs the techniques correctly. With proper implementation of controls, careful selection of panelists, effective training (when necessary), utilization of appropriate SENSORY methods, and proper statistical interpretation, SENSORY evaluation can provide a basis on which decisions can be made. It is hoped that this review of SENSORY evaluation will encourage the student to review several of the references for further information.
10 Study Questions 1. What are the differences between a Triangle test and a Duo-trio test? 2. Which one is more robust? 3. In conducting SENSORY evaluation at the winery, one must be concerned with a host of confounding issues, such as individual variability, adaptation, carry-over effects, and biases. Explain if and how each of these can be minimized. 4. In conducting a SENSORY evaluation at the winery, how does one decide how many evaluators to use? 5. Explain what is referred to as the matrix effect. 6. What is/are the relationship(s) between taste and odor? SENSORY ANALYSIS Section 5 Dr.