Transcription of Sentinel-1 Toolbox TOPS Interferometry Tutorial
1 Sentinel-1 Toolbox Copyright 2021 SkyWatch Space Applications Inc. TOPS Interferometry Tutorial Issued May 2015 Updated August 2016 Revised January 2020 Updated June 2021 Andreas Braun Luis Veci TOPS Interferometry Tutorial 2 Interferometry Tutorial The goal of this Tutorial is to provide novice and experienced remote sensing users with step-by-step instructions on interferometric processing with Sentinel-1 Interferometric Wide Swath products. Background What is Interferometry ? Interferometric synthetic aperture radar (InSAR) exploits the phase difference between two complex radar SAR observations taken from slightly different sensor positions and extracts information about the earth s surface.
2 A SAR signal contains amplitude and phase information. The amplitude is the strength of the radar response and the phase is the fraction of one complete sine wave cycle (a single SAR wavelength). The phase of the SAR image is determined primarily by the distance between the satellite antenna and the ground targets. By combining the phase of these two images after coregistration, an interferogram can be generated whose phase is highly correlated to the terrain topography. In the case of differential Interferometry (DInSAR), this topographic phase contribution is removed using a digital elevation model (DEM). The remaining variation in the interferogram can be attributed to surface changes which occurred between the two image acquisition dates, as well as unwanted atmospheric effects.
3 For an introduction to interferometric concepts, please see ESA s InSAR Principles: Guidelines for SAR Interferometry Processing and Interpretation (ESA TM-19). Sentinel-1 Interferometric Wide Swath Products The Interferometric Wide (IW) swath mode is the main acquisition mode over land for Sentinel-1 . It acquires data with a 250 km swath at 5 m by 20 m spatial resolution (single look). IW mode captures three sub-swaths using Terrain Observation with Progressive Scans SAR (TOPSAR). With the TOPSAR technique, in addition to steering the beam in range as in ScanSAR, the beam is also electronically steered from backward to forward in the azimuth direction for each burst, avoiding scalloping and resulting in homogeneous image quality throughout the swath.
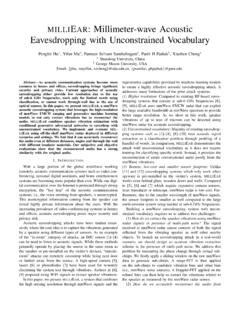
4 TOPSAR mode replaces the conventional ScanSAR mode, achieving the same coverage and resolution as ScanSAR, but with a nearly uniform SNR (Signal-to-Noise Ratio) and DTAR (Distributed Target Ambiguity Ratio). IW SLC products consist of three sub-swaths (Figure 1, red labels) image per polarization channel, for a total of three (single polarizations) or six (dual polarization) images in an IW product. Each sub-swath image consists of a series of bursts (Figure 1, white labels), where each burst has been processed as a separate SLC image. The individually focused complex burst images are included, in azimuth-time order, into a single sub-swath image with black-fill demarcation in between, similar to ENVISAT ASAR Wide ScanSAR SLC products.
5 More information on Sentinel-1 IW products is provided here: The data used in this Tutorial includes the metropolitan area around Katowice, Poland. It is part of the Upper Silesian Coal Basin where surface subsidence is reported for a considerable number of small depressions as a result of the long-year coal mining and the subsequent flooding of the mines. Figure 2 shows the extent of the Sentinel-1 data (red) and of the subset used in this Tutorial (blue). TOPS Interferometry Tutorial 3 Figure 1: Sub-swaths (red) and bursts (white) of S1 IW products (blue area is used in this Tutorial ) Figure 2: Extent and location of the data TOPS Interferometry Tutorial 4 Preparation Download the Data The data used in this Tutorial can be downloaded from the Copernicus Open Access Hub at: (login required, registration is free) Search for the two product IDs and download them.
6 S1B_IW_SLC__1 SDV_20191208T163422_20191208T163449_0192 76_024651_E2F6 S1B_IW_SLC__1 SDV_20191220T163421_20191220T163448_0194 51_024BE6_79C7 As some of the required steps are computationally intensive, it is good to store the data at a location which offers good reading and writing speed. If your computer has an internal SSD, processing should be done there to ensure best performance. Network drives or external storage devices are not recommended. Also, paths which include special characters should be avoided. In this Tutorial , the data is stored under C:\Temp\S1_InSAR\. Install snaphu This Tutorial can entirely be done within SNAP. Yet, as an external software package, snaphu (statistical-cost network-flow algorithm for phase unwrapping) has to be installed separately.
7 For more information on this tool, please visit To install the plugin in SNAP, go to Plugins (under the Tools menu, Figure 3) and search for SNAPHU Unwrapping in the Available Plugins tab. Select it and click Install. Figure 3: The Plugins interface You will be asked to proceed with Next and restart SNAP (Figure 4). This creates a menu entry for snaphu unwrapping in the Interferometry menu. TOPS Interferometry Tutorial 5 Figure 4: Installation of the snaphu plugin After you have restarted SNAP, you need to install the snaphu bundles as well. Go to Manage External Tools in the Tools menu. Select Snaphu-unwrapping and click Edit the selected operator to open the configuration (Figure 5). Select a suitable Target Folder (here C:\GIS) where snaphu will be installed and proceed with Download and Install Now.
8 You will then get a confirmation Bundle was installed in location C:\GIS\ (this may differ according to version, path and operating system). Figure 5: Installation of the snaphu bundles TOPS Interferometry Tutorial 6 Open the Products Use the Open Product button in the top toolbar and browse for the location of the downloaded data. Select the two zip files and press Open Product. In the Products View you will see the opened products. Each Sentinel-1 product consists of Metadata, Vector Data, Tie-Point Grids, Quicklooks and Bands (which contains the actual raster data, organized by polarization and sub-swath as demonstrated in Figure 1). As the data is still compressed in the zip file and each sub-swath covers a large area, it is not advised to open the bands in their current state, because it takes a considerable time until SNAP loads the raster.
9 If you still want to check the data before proceeding double-click on the Intensity_IW1_VV band to view the raster data. Another way to identify the location of your study area within the product (required for the next step), you can use the World View or World Map (to see its full extent on a base map) or open the Quicklook for a preview of the dataset in an RGB color representation. Note: If you miss any items in your user interface you can activate them in the menu under View and Tool Windows. The World View or World Map menus are also a good way to check if your image belong to the same relative orbit (required for Interferometry ) and if they are shifted along-track. The latter is allowed for Interferometry but needs to be taken into account in the next step (TOPS Split).
10 Figure 6: Product Explorer and World Map Coregistration To exploit the phase difference of the acquisitions, a stack containing both products must be created first. Coregistration makes use of image statistics to align both products at sub-pixel accuracy. While conventional Stripmap radar products can be coregistered within one step, S1 TOPSAR products require a series of steps, because of their special form of acquisition (Figure 1). SNAP offers to combine all these steps within the S-1 TOPS Coregistration with ESD operator, but this processing chain consumes a lot of memory. In this Tutorial , the single steps to correctly coregister the products are performed individually and successively.