Transcription of Settlement of a Pile Group — A Back Calculation of …
1 Settlement of a pile Group A back Calculation of a Case History Bengt H. Fellenius Report to UniSoft Ltd., August 2002, expanded It is commonly thought presumed that when piles are installed to an adequate factor-of-safety on capacity, Settlement issues are taken care of automatically. This is not necessarily so, as shown in the following case history of a settling foundation for a furnace bank. A back -analysis of the case data illustrates that Settlement analysis of the piled foundation could have been carried out as a part of the original design applying simple, well-established methods, and the observed Settlement need not have surprised the designers of the foundation. The case history is quoted from a paper by Golder and Osler (1968)1 presenting a case history of twelve years of Settlement of a bank of five furnaces at the QIT plant in Sorel, Quebec.
2 Each furnace has an 16 m by 10 m footprint and is supported on a Group of thirty-two m diameter expanded-base piles (Franki piles) with 6 m embedment installed to a depth of m and c/c of from m and m. The furnaces are placed at a depth of m about 6 m apart over an about 16 m by 55 m area. The total furnace load is 21 MN/furnace, , a load of 670 kN/ pile and an average stress of 130 kPa over each 160-m2 furnace footprint. The soil profile consists of compact alluvial brown sand to a depth of m, a m thick interbedded layer of fine sand and soft clay, and compact to dense grey sand to 19 m depth. The sand is deposited on 5 m of sandy clay on a 40+ m thick layer of Champlain Sea clay (formerly called Leda clay). The groundwater table is assumed to lie at a depth of 4 m and the pore pressures distribution is assumed to be hydrostatically distributed.
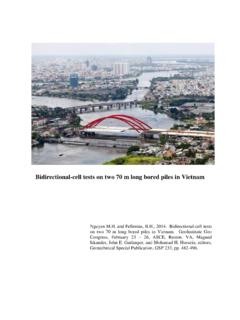
3 The paper reports results on laboratory tests available from four Champlain Sea clay samples obtained in a borehole at depths ranging from 14 m through 38 m located approximately 2,000 m away from the QIT site. Fig. 1 shows the results of one of these tests. The four tests indicate virgin Janbu modulus numbers ranging from about 5 through 9, a re-loading modulus number of about 90, and a preconsolidation stress margin of 30 kPa through 80 kPa. The values are in tolerable agreement with typical values for Champlain Sea clay, usually exhibiting Janbu virgin and re-loading modulus numbers of 7 and 60, respectively, and a preconsolidation margin of at least 30 kPa. Fig. 1 Void ratio versus stress from consolidation test on sample from Champlain Sea clay 1 Golder, and Osler , 1968.
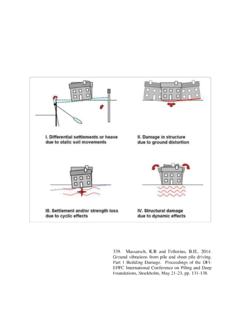
4 Settlement of a furnace foundation, Sorel, Quebec. Canadian Geotechnical Journal 5(1) 46-56. ,00010,000 Stress (KPa)Void Ratio (- -)RR = = 90CR = m = 9 DEPTH = 14 m '0 = 230 KPa 'c = 280 KPaBengt H. Fellenius Page 2 The layout of one furnace pile Group and the main soil profile is sketched in Fig. 2. Fig. 2 Sketch of furnace pile Group and soil profile Figure 3 shows the load-movement curve of a static loading test performed on one of the piles to a maximum load of 1,800 kN, twice the working load. The load-movement curve of the test was essentially a straight line indicating that the pile capacity is much larger than the maximum load applied in the test and consisting mostly of toe resistance. The measured movement of the piles for a load equal to the working load was about 1 mm.
5 The load-movement of the pile toe for the applied load is considered small, a few millimetre only. The test results were used to predict that the Settlement of the furnace under full load would amount to 10 mm. Fig. 3 Load-movement curves from the static loading test 05001,0001,5002,00001234 MOVEMENT (mm)LOAD (KN)vvvvvvvvvvvvvv24 m of Compact SAND50 m Champlain CLAY10 m18 m6 m pile Embedment pile Toe at m DepthBengt H. Fellenius Page 3 The furnaces were built in early 1951. Settlement of the furnaces was monitored until November 1965. Fig. 4 presents the layout in plan of the five furnaces and location of the Settlement monitoring points. Fig. 5 presents settlements across a section through the furnaces measured from April 1951 (when all five furnaces were completed) through January 1962.
6 The "zero" reading was taken earlier for Furnace #1 than for Furnace #2 through 5, that is, the amount of initial Settlement included in the records is not the same for the bank of five furnaces. Fig. 4 Layout of furnaces and observation points Fig. 5 Settlements from early 1951 through January 1962 #1#2#3#4#554 m16 mNORTHSOUTH020406080 SETTLEMTN (mm)Apr. 1951 Nov. 1951 Aug. 1952 Jan. 1962 Furnace #1 Furnace #2 Furnace #3 Furnace #4 Furnace #5 Bengt H. Fellenius Page 4 Fig. 6 shows the settlements versus time with approximate trend lines superimposed. The dashed trend lines represent measurements at center of Furnaces #1 and #5 ("Side Furnaces") and measurements taken between Furnaces #2 and #3 and Furnaces #3 and #4, (the "Center Furnaces").
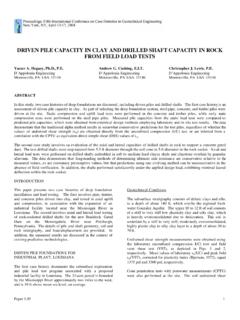
7 The trend lines imply that the consolidation is more or less completed after the twelve years. The small Settlement occurring after January 1962 is due to secondary compression. Fig. 6 Settlements plotted versus time It is qualitatively obvious that the soil stresses due to the furnace loads will be the largest under the center furnace, Furnace #3, and be the smallest for the two end furnaces, Furnaces #1 and #5. The stress distributions can be determined numerically. Fig. 7 shows the Boussinesq stress distributions underneath each furnace as caused by the load on one furnace, Furnace #1, and calculated with the UniSettle program2. The stress distributions indicate that the load on one furnace has little effect beyond the depth of one furnace width, about 10 m.
8 However, the stresses from all five furnaces accumulate and the Settlement difference between the center and the edges of the furnace bank is not that large. Figure 8 shows the calculated Boussinesq stress distribution below the outside edge of Furnaces #1 and #5 and below the center of Furnace #3. Note that for a preconsolidation margin of, say, 30 kPa, at the depth interval of 30 m through 40 m, the Settlement caused by the stress below the center of Furnace #3 will result in significantly larger Settlement as opposed to those from the stress below the outside edge of Furnaces #1 and #5, where the imposed stress is smaller than the preconsolidation margin. 2 Fellenius, and Goudreault, , 1996.
9 UniSettle Users Manual, UniSoft Ltd., [ ], 76 p. 01020304050607080 YEARSSETTLEMENT (mm)1950195519601965 North and South Side FurnacesCenterFurnacesBengt H. Fellenius Page 5 Fig. 7 Boussinesq stress distribution for the stress from Furnace #1 under its own center and under the center of Furnaces #2, #3, and #4 Fig. 8 Boussinesq stress distribution below the outside edge of Furnace #1 and the center of Furnace #3 The imposed stress from the furnaces resulted in settlements as governed by the soil compressibility and preconsolidation margin. Reasonably, during the first about half a year, all the initial Settlement and most the Settlement in the dominantly sand soils above the depth of 24 m will have developed, and the thereafter occurring Settlement is from consolidation of the clay soils below this depth.
10 The observed Settlement after November 1951 measured at the center of the furnace bank, Furnace #3, is matched to a Calculation using input that is typical for the soils at the site. As mentioned, most of the Settlement in the 010203040506070050100150200250 STRESS (KPa)DEPTH (m)Center of Furnace #3 Outside Edge of Furnace #1 Preconsolidation Margin0102030405060700204060801001201401 60180200 STRESS (KPa)DEPTH (m)Center of Furnace #1 Center of Furnace #2 Center of Furnace #3 Center of Furnace #4 Bengt H. Fellenius Page 6 sand soils must have occurred before that time. Therefore, the key input to the calculations consists of the input representing the two layers of clay between the depths of 24 m and 29 m and below 29 m, respectively, , virgin and re-loading modulus numbers and preconsolidation margin.