Transcription of Seven Basic Tools of Quality Control: An Appropriate ... - LMU
1 Munich Personal RePEc Archive Seven Basic Tools of Quality Control: An Appropriate Tools for Solving Quality Problems in the Organizations Neyestani, Behnam March 2017. Online at MPRA Paper No. 77681, posted 20 Mar 2017 16:23 UTC. 1. Seven Basic Tools of Quality Control: An Appropriate Tools for Solving Quality Problems in the Organizations Behnam Neyestani Abstract: Dr. Kaoru Ishikawa was first total Quality management guru, who has been associated with the development and advocacy of using the Seven Quality control (QC) Tools in the organizations for problem solving and process improvements. Seven old Quality control Tools are a set of the QC Tools that can be used for improving the performance of the production processes, from the first step of producing a product or service to the last stage of production. So, the general purpose of this paper was to introduce these 7 QC Tools . This study found that these Tools have the significant roles to monitor, obtain, analyze data for detecting and solving the problems of production processes, in order to facilitate the achievement of performance excellence in the organizations.
2 Keywords: Seven QC Tools ; Check Sheet; Histogram; Pareto analysis ;. Fishbone Diagram; Scatter Diagram; Flowcharts, and Control Charts. INTRODUCTION. There are Seven Basic Quality Tools , which can assist an organization for problem solving and process improvements. The first guru who proposed Seven Basic Tools was Dr. Kaoru Ishikawa in 1968, by publishing a book entitled Gemba no QC Shuho that was concerned managing Quality through techniques and practices for Japanese firms. It was intended to be applied for self-study, training of employees by foremen or in QC reading groups in Japan. It is in this book that the Seven Basic Quality control Tools were rst proposed. valuable resource when applying the Seven Basic Tools (Omachonu Neyestani B. (2017, March). Seven Basic Tools of Quality Control: An Appropriate Tools for Solving Quality Problems in the Organizations.. 2. and Ross, 2004). These Seven Basic Quality control Tools , which introduced by Dr.
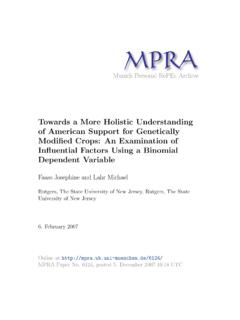
3 Ishikawa, are : 1) Check sheets; 2) Graphs (Trend analysis ); 3). Histograms; 4) Pareto charts; 5) Cause-and-effect diagrams; 6) Scatter diagrams; 7) Control charts. Figure 1 indicates the relationships among these Seven Tools and their utilizations for the identification and analysis of improvement of Quality (Kerzner, 2009). Figure 1: The Seven Quality control Tools (Kerzner, 2009). Check Sheet Check sheets are simple forms with certain formats that can aid the user to record data in an firm systematically. Data are collected and tabulated on the check sheet to record the frequency of specific events during a data collection period. They prepare a consistent, effective, and economical approach that can be applied in the auditing of Quality assurance for reviwing and to follow the steps in a particular process. Also, they help the user to arrange the data for the utilization later (Montgomery, 2009; Omachonu and Ross, 2004). The main advantages of check sheets are to be very easily to apply and understand, and it can make a clear picture of the situation and condition of the organization.
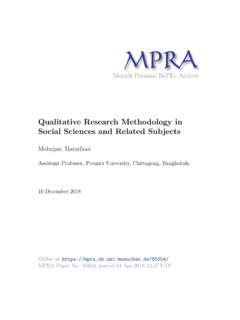
4 They are efficient and powerful Tools to identify frequently problems, but they dont have effective ability to analyze the Quality problem into the workplace. The chech sheets are in several, three major types are such as Defect-location check sheets; tally check sheets, and; defect-cause check sheets (Kerzner, 2009). Figure 2 is depicted a tally Neyestani B. (2017, March). Seven Basic Tools of Quality Control: An Appropriate Tools for Solving Quality Problems in the Organizations.. 3. check sheet that cn be used for collecting data during production process. Figure 2: Check sheet (Tally) for telephone interruptions Histogram Histogram is very useful tool to describe a sense of the frequency distribution of observed values of a variable. It is a type of bar chart that visualizes both attribute and variable data of a product or process, also assists users to show the distribution of data and the amount of variation within a process.
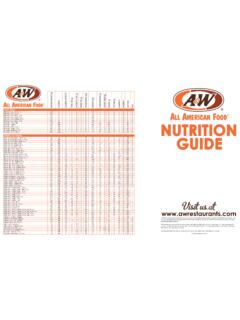
5 It displays the different measures of central tendency (mean, mode, and average). It should be designed properly for those working into the operation process can easily utilize and understand them. Also, a histogram can be applied to investigate and identify the underlying distribution of the variable being explored (Omachonu and Ross, 2004;. Forbes and Ahmed, 2011). Figure 3 illustrates a histogram of the frequency of defects in a manufacturing process. Figure 3: Histogram for variables Neyestani B. (2017, March). Seven Basic Tools of Quality Control: An Appropriate Tools for Solving Quality Problems in the Organizations.. 4. Pareto analysis It introduced by an Italian economist, named Vilfredo Pareto, who worked with income and other unequal distributions in 19 th century, he noticed that 80% of the wealth was owned by only 20% of the population. later, Pareto principle was developed by Juran in 1950. A Pareto chart is a special type of histogram that can easily be apply to find and prioritize Quality problems, conditions, or their causes of in the organization (Juran and Godfrey, 1998).
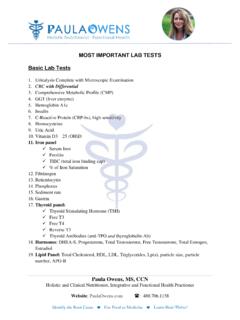
6 On the other hand, it is a type of bar chart that shows the relative importance of variables, prioritized in descending order from left to right side of the chart. The aim of Pareto chart is to figure out the different kind of nonconformity from data figures, maintenance data, repair data, parts scrap rates, or other sources. Also, Pareto chart can generate a mean for investigating concerning Quality improvement, and improving ef ciency, material waste, energy conservation, safety issues, cost reductions , etc., as Figure 4 demonstrated concerning Pareto chart, it can able to improve the production before and after changes (Montgomery, 2009; Kerzner, 2009;. Omachonu and Ross, 2004). Figure 4: Pareto Charts Neyestani B. (2017, March). Seven Basic Tools of Quality Control: An Appropriate Tools for Solving Quality Problems in the Organizations.. 5. Fishbone Diagram Kaoru Ishikawa is considered by many researchers to be the founder and first promoter of the Fishbone' diagram (or Cause-and-Effect Diagram) for root cause analysis and the concept of Quality Control (QC) circles.
7 Cause and effect diagram was developed by Dr. Kaoru Ishikawa in 1943. It has also two other names that are Ishikawa diagram and fishbone because the shape of the diagram looks like the skeleton of a fish to identify Quality problems based on their degree of importance (Neyestani, 2017). The cause and effect diagram is a problem-solving tool that investigates and analizes systematically all the potential or real causes that result in a single effect. On the other hand, it is an efficient tool that equips the organization's management to explore for the possible causes of a problem (Juran and Godfrey, 1998). This diagram can provide the problem-solving efforts by gathering and organizing the possible causes , reaching a common understanding of the problem, exposing gaps in existing knowledge, ranking the most probable causes , and studying each cause (Omachonu and Ross, 2004). The generic categories of the cause and effect diagram are usually six elements ( causes ) such as environment, materials, machine, measurement, man, and method, as indicated in Figure 5.
8 Furthermore, potential causes . can be indicated by arrows entering the main cause arrow (Neyestani, 2017). Figure 5: The cause and effect diagram (Fishbone Diagram). Neyestani B. (2017, March). Seven Basic Tools of Quality Control: An Appropriate Tools for Solving Quality Problems in the Organizations.. 6. Scatter Diagram Scatter diagram is a powerful tool to draw the distribution of information in two dimensions, which helps to detect and analyze a pattern relationships between two Quality and compliance variables (as an independent variable and a dependent variable), and understanding if there is a relationship between them, so what kind of the relationship is (Weak or strong and positive or negative). The shape of the scatter diagram often shows the degree and direction of relationship between two variables, and the correlation may reveale the causes of a problem. Scatter diagrams are very useful in regression modeling (Montgomery, 2009; Oakland, 2003).
9 The scatter diagram can indicate that there is which one of these following correlation between two variables: a) Positive correlation; b) Negative correlation, and c) No correlation, as demonstrated in Figure 6. Figure 6: Scatter Diagrams Flowchart Flowchart presents a diagrammatic picture that indicats a series of symbols to describe the sequence of steps exist in an operation or process. On the other hand, a flowchart visualize a picture including the inputs, activities, decision points, and outputs for using and understanding easily concerning the overall objective through process. This chart as a problem solving tool can apply methodically to detect and analyze the areas or points Neyestani B. (2017, March). Seven Basic Tools of Quality Control: An Appropriate Tools for Solving Quality Problems in the Organizations.. 7. of process may have had potential problems by documenting and explaining an operation, so it is very useful to find and improve Quality into process (Forbes and Ahmed, 2011), as shown in Figure 7.
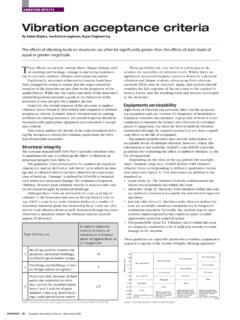
10 Figure 7: Flow chart of review process Control Chart Control chart or Shewhart control chart was introduced and developed by Walter A. Shewhart in the 1920s at the Bell Telephone laboratories , and is likely the most technically sophisticated for Quality management (Montgomery, 2009). Control charts is a special form of run chart that it illustrates the amount and nature of variation in the process over time . Also, it can draw and describe what has been happning in the process. Therefore, it is very important to apply control chart, becaust it can observe and moniter process to study process that is in statistical control (No problem with Quality ) accordant to the samplings or samplings are betwwen UCL and LCL. (upper control limit (UCL) and the lower control limit (LCL)). statistical control is not between UCL and LCL, so it means the process is out of control, then control can be applied to finde causes of Quality problem, as Neyestani B.