Transcription of Shifting Graphs - Math
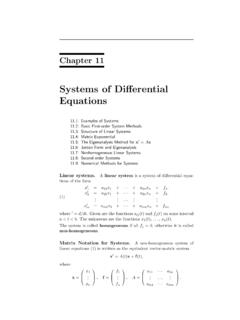
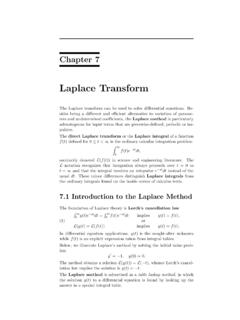
1 Digital Lesson Shifting Graphs The Graphs of many functions are transformations of the Graphs of very basic functions. Example: y y = x2 + 3. The graph of y = x2 + 3 8. is the graph of y = x2 y = x2. shifted upward three units. 4. This is a vertical shift. x -4 4. The graph of y = -x2 is the -4. reflection of the graph of y = -x2. y = x2 in the x-axis. -8. Copyright by Houghton Mifflin Company, Inc. All rights reserved. 2. Vertical Shifts If c is a positive real number, the graph of f(x) + c is the graph of y = f(x) shifted upward c units. If c is a positive real number, the graph of f(x) c is the graph of y = f(x) shifted downward c units. y f(x) + c f(x). +c -c f(x) c x Copyright by Houghton Mifflin Company, Inc. All rights reserved. 3. Example: Use the graph of f (x) = |x| to graph the functions f (x) = |x| + 3 and f (x) = |x| 4. y f (x) = |x| + 3. 8. f (x) = |x|.
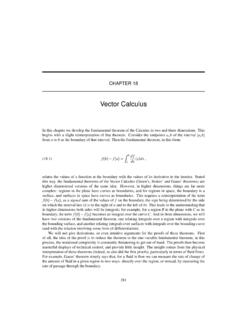
2 4. f (x) = |x| 4. x -4 4. -4. Copyright by Houghton Mifflin Company, Inc. All rights reserved. 4. Horizontal Shifts If c is a positive real number, then the graph of f (x c) is the graph of y = f (x) shifted to the right c units. y If c is a positive real -c +c number, then the graph of f (x + c) is the graph of y = f (x). shifted to the left x c units. y = f (x + c) y = f (x) y = f (x c). Copyright by Houghton Mifflin Company, Inc. All rights reserved. 5. Example: Use the graph of f (x) = x3 to graph f (x) = (x 2)3 and f (x) = (x + 4)2 . y f(x) = x3. 4. -4 4. x f (x) = (x + 4)2 f (x) = (x 2)3. Copyright by Houghton Mifflin Company, Inc. All rights reserved. 6. Example: graph the function y x 5 4. using the graph of y x. First make a vertical shift Then a horizontal shift 5. 4 units downward. units left. y y 4 y x 4. (4, 2) y x 5 4. (0, 0). x x -4 -4. (4, -2) y x 4 (-1, -2).
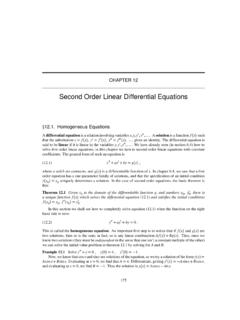
3 (0, -4) (-5, -4). Copyright by Houghton Mifflin Company, Inc. All rights reserved. 7. The graph of a function may be a reflection of the graph of a basic function. The graph of the function y = f (-x) is the graph of y = f (x) reflected in the y-axis. y The graph of the y = f (-x) y = f (x). function y = -f (x). x is the graph of y = f (x). reflected in the x-axis. y = -f (x). Copyright by Houghton Mifflin Company, Inc. All rights reserved. 8. Example: graph y = -(x + 3)2 using the graph of y = x2. First reflect the graph Then shift the graph in the x-axis. three units to the left. y y 4 y = x2 4. (-3, 0). x x -4 4 4. -4. y = - (x + 3)2. y = -x 2. Copyright by Houghton Mifflin Company, Inc. All rights reserved. 9. Vertical Stretching and Shrinking If c > 1 then the graph of y = c f (x) is the graph of y = f (x). stretched vertically by c. If 0 < c < 1 then the graph of y = c f (x) is the graph of y = f (x).
4 Shrunk vertically by c. y = x2 y y = 2x2. Example: y = 2x2 is the graph of y = x2. 4. stretched vertically by 2. 1 2. 1 2 is the graph of y = x2 y x y x 4. 4. shrunk vertically by 1 . x 4 -4 4. Copyright by Houghton Mifflin Company, Inc. All rights reserved. 10. Horizontal Stretching and Shrinking If c > 1, the graph of y = f (cx) is the graph of y = f (x). shrunk horizontally by c. If 0 < c < 1, the graph of y = f (cx) is the graph of y = f (x). stretched horizontally by c. Example: y = |2x| is the y y = |2x|. graph of y = |x| shrunk y = |x|. horizontally by 2. 4. 1. y x 1 2. y x is the 2. graph of y = |x| stretched horizontally by 1 . x -4 4. 2. Copyright by Houghton Mifflin Company, Inc. All rights reserved. 11. Example: graph y 1 ( x 1) 3 3 given the graph y = x3. 2. graph y = x3 and do one transformation at a time. y y 8 8. 4 4. x x 4 4. -4 -4. 1. Step 3: y ( x 1) 3.
5 Step 1: y = x3 2. 1. Step 2: y = (x + 1)3 Step 4: y ( x 1) 3 3. 2. Copyright by Houghton Mifflin Company, Inc. All rights reserved. 12.