Transcription of Six Sigma Basics - MIT OpenCourseWare
1 Six Sigma Basics Six Sigma Basics - Slide 2 2012 Massachusetts Institute of Technology Learning Objectives At the end of this module, you will be able to: Recognize that Six Sigma is a valuable approach for improving process quality Interpret a basic Statistical Process Control chart Distinguish between process and specified control limits Describe a capable process Six Sigma Basics - Slide 3 2012 Massachusetts Institute of Technology What is Six Sigma ? A Strategy to improve process quality by identifying and eliminating defects and minimizing variation in process outputs A data driven approach based on Measurement of the process variation using Statistical Process Control A structured Implementation approach based on a DMAIC cycle and certified experts The goal of Six Sigma is to reduce process variation Six Sigma Basics - Slide 4 2012 Massachusetts Institute of Technology Standard Normal Distribution Curve Some notable qualities of the
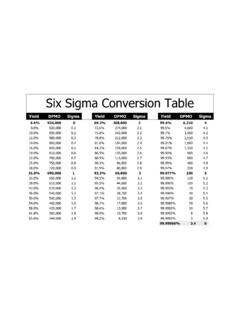
2 Normal distribution: The mean is also its mode and median. of the area (green) is within one standard deviation of the mean. of the area (green & yellow) is within two standard deviations. of the area (green & yellow & red) is within three standard deviations 1 2 3 Sigma ( ) = one standard deviation Six Sigma Basics - Slide 5 2012 Massachusetts Institute of Technology Defects Defect is defined as any process output that does not meet the customer s specifications. Improving quality means reducing the defects per million opportunities ( dpmo ).
3 There are two attributes to this metric that can be controlled: Opportunities reducing the number of steps, handoffs and other opportunities will help improve quality Defects reducing the number of defects for each process step through continuous process improvement will help improve quality Six Sigma Basics - Slide 6 2012 Massachusetts Institute of Technology Six Sigma Practical Meaning 20,000 lost articles of mail per hour Unsafe drinking water for almost 15 minutes per day 5,000 incorrect surgical operations per week Two short or long landings at most major airports each day 200,000 wrong drug prescriptions each year No electricity for almost seven hours each month Seven articles of mail lost per hour One unsafe minute every seven months incorrect operations per week One short or long landing every five years 68 wrong prescriptions each year One hour without electricity every 34 years 99% GOOD ( Sigma ) GOOD (6 Sigma )
4 Six Sigma Basics - Slide 7 2012 Massachusetts Institute of Technology Statistical Process Control Control charting is the primary tool of SPC Control charts provide information about the stability/predictability of the process, specifically with regard to its: Central tendency (to target value) Variation SPC charts are time-sequence charts of important process or product characteristics Six Sigma Basics - Slide 8 2012 Massachusetts Institute of Technology Class Exercise Pharmacy wants to monitor the dispensing of doses of White Bean Medicine A 3 cup sample will be taken each day and weighed and recorded on a check sheet Data will be entered into two control charts (one for means or averages and one for range)
5 Data for the first twenty days will establish the current process capability From then on, the pharmacy will monitor the dosages by entering daily samples into the control chart Process improvements will be made as needed, based upon data collected. Six Sigma Basics - Slide 9 2012 Massachusetts Institute of Technology What To Do Phase I Process Capability Select three cups with the same sample number (day) Weigh each on the digital scale Record the data on the check sheet form and calculate the mean (average) and report the results to the instructor Also report the lowest and highest weights for each day.
6 Calculate range = highest - lowest Six Sigma Basics - Slide 10 2012 Massachusetts Institute of Technology Six Sigma Process - DMAIC Define Who are the customers and what are their requirements Identify key characteristics important to the customer Measure Categorize key input and output characteristics, verify measurement systems Collect data and establish the baseline performance Analyze Convert raw data into information to provide insights into the process Improve Develop solutions to improve process capability and compare the results to the baseline performance Control Monitor the process to assure no unexpected changes occur Six Sigma Basics - Slide 11 2012 Massachusetts Institute of Technology Simple DMAIC Example DMAIC is easy to see in process control applications The same steps
7 Can be used to analyze more complex systems, often in tandem with lean tools Process Input Output Define Improve Improved Process Control Analyze Measure Measurement System Six Sigma Basics - Slide 12 2012 Massachusetts Institute of Technology Types of Process Variation Common Cause Variation is the sum of many chances causes, none traceable to a single major cause. Common cause variation is essentially the noise in the system. When a process is operating subject to common cause variation it is in a state of statistical control.
8 Special Cause Variation is due to differences between people, machines, materials, methods, etc. The occurrence of a special (or assignable) cause results in an out of control condition. Control charts provide a means for distinguishing between common cause variability and special cause variability Six Sigma Basics - Slide 13 2012 Massachusetts Institute of Technology Control Chart Example - Patient Falls Reference: National Quality Measures Clearing House UCL LCL Phase I Establish Process Capability Phase II Monitor the Process Six Sigma Basics - Slide 14 2012 Massachusetts Institute of Technology What To Do Phase II Process Monitoring Draw control limits on your chart based on the first 20 samples.
9 Weigh a new sample (3 cups), record the data on the 2nd check sheet and calculate the average and range. Plot the average and range on the charts, and decide if the process is in control. If the process goes out of control, stop and investigate the cause using a fishbone diagram. UCL LCL Six Sigma Basics - Slide 15 2012 Massachusetts Institute of Technology Control Chart Example - c Chart for Resident Falls Source: Faten Mitchell, Quality Improvement Advisor, Health Quality Ontario Courtesy of Faten Mitchell, Quality Improvement Advisor, Health Quality Ontario.
10 Used with Sigma Basics - Slide 16 2012 Massachusetts Institute of Technology Process Improvement and Control Charts - Starting Process Input Output In early stages, control charts (usually on output variables) are used to understand the behavior of the process After corrective actions, place charts on critical input variables Measurement System Six Sigma Basics - Slide 17 2012 Massachusetts Institute of Technology Process Improvement and Control Charts - Sustaining The goal: Monitor and control inputs and, over time, eliminate the need for SPC charts by having preventative measures in place If a chart has been implemented, remove it if it is not providing valuable and actionable information Process Input Output Measurement System Six Sigma Basics - Slide 18 2012 Massachusetts Institute of Technology Process Capability Process Capability is broadly defined as the ability of a process to meet customer expectations (Bothe, 1997)