Transcription of Six Sigma Yellow Belt - ASQ
1 Six Sigma Yellow belt Course Overview and Learning Objectives Note: This outline is identical for the Healthcare, Financial Services, and Services versions. The difference for each course lies in the customized case studies, examples and exercises. SUMMARY This course provides an overview of Six Sigma concepts and the Define Measure Analyze Improve . Control process, along with a group of basic problem solving tools. The Six Sigma Yellow belt course is comprised of three sessions, with lessons on specific topics within each session. The first session provides an overview of Six Sigma concepts, background, and the Six Sigma improvement process (D M . A I C). The second and third sessions will show you how to develop and apply specific Six Sigma tools and methods to arrive at a solution to a business challenge to make things better. Session One can be completed as a self study assignment and should take you 2 3 hours to complete.
2 The course is designed so that you can cover individual lessons over a period of time. At the beginning of Session Two, you will learn how to apply project selection and team chartering skills. It is suggested, but not required, that you work on an actual project while taking the course. The time required to complete Sessions Two and Three depends greatly upon the nature of your project and the time required to resolve project specific issues. As you become proficient in all of the tools necessary to define, measure, analyze, improve, and control Six Sigma improvement projects, you will be prepared to play an important role as part of a Six Sigma improvement team. LEARNING OBJECTIVES The overall learning objective of this course is to help you become an effective member of a process improvement team engaged in a Six Sigma project intended to help your organization perform better.
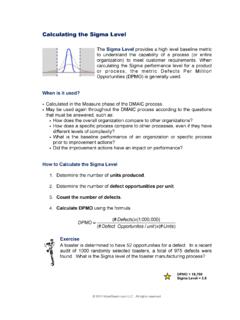
3 After completing this course, you should be able to do the following: Session One: Introduction to Six Sigma Communicate using Six Sigma concepts. Relate Six Sigma concepts to the overall business objective. Accept the need to improve company performance to meet the requirements of the marketplace. Think about your work as a process, with inputs that determine the output. Calculate the Sigma Level for a process or organization. Use the five step D M A I C model to improve processes. Copyright 2000 2010 by LLC Powered by Session Two: Tools for Improvement Define & Measure Participate in the development or refinement of a project charter. Construct a Process Map that identifies all of the steps of a process, along with the inputs and output. Build a Pareto Chart to set priorities. Use an Affinity Diagram and CTQ Tree to clarify customer requirements.
4 Create a Trend Chart to evaluate performance of a process over time. Create a Control Chart to evaluate process stability and performance over time. Construct a Histogram to analyze the data from a process. Session Three: Tools for Improvement Analyze, Improve, Control Use a Fishbone Chart to identify potential root causes. Identify the root cause of a problem by asking "Why?" five times. Use Failure Mode and Effect Analysis to set priorities for improvement. Engage in Brainstorming to identify actions for improvement. Select the best solution. Pilot the selected solution. Document process changes and use a control plan to prevent backsliding. COURSE STRUCTURE AND REQUIREMENTS MoreSteam courses provide content on demand to offer the highest degree of student flexibility. You can set your own schedule and progress at your own speed, terminating and re entering sessions whenever you wish.
5 All course sessions use a mix of multimedia to present material, including text, synchronized audio slide shows, diagrams, charts, audio lectures, and simulations. Links to outside research resources are provided to explore chosen subjects in greater detail. Course access is provided for 120 days beginning at the time of enrollment. As you work through the course you will be asked to demonstrate knowledge and understanding in four ways: Interactive Practice Exercises will be presented throughout each session so that you can try your new skills and get immediate feedback. Supplemental Exercises will be presented at the end of every session to practice new concepts. Supplemental Exercises are self graded and may be shared in the Virtual Classroom Discussion area. Quizzes will be conducted at the end of every session. Quizzes are interactive, and provide immediate feedback to close the learning loop.
6 Project: We strongly suggest that a meaningful project should accompany this coursework. The learning experience will be enhanced significantly if concepts and tools are practiced on a real . world project as the course is completed. Project experience may be accomplished by participating as a Black belt or Green belt project team member, or by undertaking a smaller project within your own scope of responsibility. Copyright 2000 2010 by LLC Powered by COURSE SEQUENCE The course is presented in a logical sequence to follow the Six Sigma DMAIC improvement process. We believe that you will learn most efficiently by following the sequence presented. In particular, the first session presents an overview of Six Sigma , which will be helpful to put the remaining sessions in proper context. However, the sessions are modular, and we encourage you to explore the material.
7 You are free to move forward and backward throughout the course. You can skip ahead or go back and review material that you already covered. The course map feature allows you to move point to point, from anywhere to anywhere. The course map status column will tell you which pages you have visited. HOW TO NAVIGATE AND USE RESOURCES Navigation aids are located in the Navigation Frame to the left of the text screen, and can be activated by clicking on the icon or text. Return to the MoreSteam University home page by clicking on the icon in the upper left corner of the navigation frame. Click on Course Overview (the course name) in the navigation box to return to this page to review course requirements or other general information. Consult the dynamic Course Map to identify your current location or to move around the course. The Course Map bookmarking feature will take you back to the point where you last terminated your session.
8 Join a Virtual Classroom Discussion through the Discuss link. The Virtual Classroom Discussion is a threaded discussion forum among all current students, with input from the instructor. Access the MoreSteam Toolbox through the navigation box to research process improvement tools. The What's New link highlights recent modifications to the course. This window will automatically appear upon log in whenever there is a new update. Outside Research Resources provides links to useful websites and recommended books. The "Instructor" link provides a shortcut to send an email to the course instructor. Access a notepad to record your class notes by clicking on "Notes" link in the navigation box. Notes will be indexed by your current course location for easy reference, and can be printed in summary form. The "Account Info" link provides a vehicle to update your email address, phone number, or location, and shows the number of access days remaining.
9 The "Quiz Stats" link provides a summary of quiz results by session, including detail on any skipped or missed questions. The "SigmaPedia" link opens SigmaPedia, online Lean Six Sigma encyclopedia. The "StatMaster" link opens an interactive wizard to guide statistical analysis. From any point in the course you can open a D M A I C flowchart by clicking on the Six Sigma icon in the lower left corner of the navigation bar. The Help icon in the lower left corner of the navigation bar opens an Internal Search Function and a Glossary of Terms: Copyright 2000 2010 by LLC Powered by Synchronized audio slide shows will display without use of a separate media player, but you must enable your browser to read Java (Tools/Internet Options/Advanced/Microsoft VM/Check All Boxes). When you see a slide show icon displayed in the right margin of the course, click on the icon to load the media.
10 CERTIFICATE OF COMPLETION Upon completion of this course (review of all lessons and completion of quiz modules) a certificate of completion will be provided. COURSE MATERIALS Materials Provided by MoreSteam The course includes Microsoft Excel templates for problem solving and statistical analysis. The templates are available as downloads within the course material. Materials Provided by Student/Company General purpose statistics software is useful but not necessary. Excel templates are provided by the course for statistical analysis. If you do not have a statistics package, options range from free internet downloads to higher end packages like Minitab, Statistica, JMP etc. You can download a 30 day evaluation copy of most statistics packages over the web. Microsoft Office (Word, Excel, PowerPoint). Office 2003 or higher is recommended. Office 97 and 2000 do not take advantage of all Excel template features.
