Transcription of SM United States Commodity Index Fund
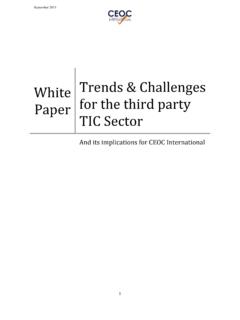
1 This investment is not suitable for all investors. Funds that focus on a single sector generally experience greater Q4 USCI United States Commodity Index FundSMThis chart shows how a hypothetical investment of $10,000 in the fund at its inception would have performed versus an investment in the fund s benchmark Index . The values indicate what $10,000 would have grown to over the time period indicated. The hypothetical example does not represent the returns of any particular Data as of 12/31/17 Ticker Symbol .. USCII ntra-day Indicative Ticker ..$ Shares Outstanding ..11,800,000 Total Net Assets ..$501,248,205 CUSIP.
2 911717106 Primary Exchange ..NYSE ArcaManagement Fee .. Expense Ratio .. Volatility (Jan 2008 - Dec 2017)SDCI TR .. TR .. OY TR .. Index .. GSCI TR .. : BloombergFund Benefits USCI has equity-like features including, intra-day pricing, and market, limit, and stop orders. USCI offers Commodity exposure without using a Commodity futures account. USCI provides Portfolio holdings, Market price, NAV and TNA on its website each United States Commodity Index fund (USCI) is an exchange-traded product that seeks to track the performance of the SummerHaven Dynamic Commodity Index Total Return, less fund expenses. USCI is designed to be a convenient, cost-effective way for investors to access the returns of a portfolio of commodities futures contracts and is listed on the NYSE Arca.
3 The SummerHaven Dynamic Commodity Index Total ReturnSM (SDCITR) is an Index designed to reflect the performance of a portfolio of 14 Commodity futures. The Index is reconstructed each month from 27 possible futures contracts. The 14 selected contracts are equally weighted and represent six sectors: Energy (WTI crude oil, Brent crude oil, natural gas, heating oil, gasoil, RBOB gasoline), Precious Metals (gold, silver, platinum), Industrial Metals (aluminum, copper, lead, nickel, tin, zinc), Grains (corn, soybeans, soybean meal, soybean oil, wheat), Livestock (live cattle, feeder cattle, lean hogs) and Softs (coffee, cocoa, cotton and sugar). The SDCITR uses market price signals, including backwardation and 12 month price change, as part of its rules-based selection method.
4 USCI is rebalanced monthly to reflect these changes to the Index . fund Performance as of 12/31/171 month3 monthYear-to-Date1 Year5 YearSince InceptionCumulative(8/10/2010)Since InceptionAnnualized(8/10/2010) performance quoted represents past performance, does not guarantee future results and current performance may be lower or higher than the data quoted. The fund s net asset value per share ( NAV ) is calculated by dividing the value of the fund s total assets less total liabilities by the number of shares outstanding. Share Price returns are based on closing prices for the fund and do not represent the returns an investor would receive if shares were traded at other of a $10,000 Investment as of 12/31/17 SPGSCI TR USCISDCI TRDBLCDBCTRICIGLTRBCOM TR$4,000$5,000$6,000$7,000$8,000$9,000$1 0,000$11,000$12,000$13,000$14,000$15,000 12/31/109/30/108/10/103/31/116/30/129/30 /1212/31/123/31/126/30/1312/31/133/31/14 6/30/149/30/133/31/136/30/119/30/1112/31 /1112/31/149/30/149/30/156/30/156/30/161 2/31/179/30/179/30/163/31/1612/31/153/31 /173/31/1512/31/166/30/17 Among 114 Commodities Broad Basket ETFs and open-end funds, as of 12/31/2017 based on risk-adjusted returns.
5 As of 12/31/2017, the United States Commodity Index fund was rated 4 stars out of 114 based Commodities Broad Basket ETFs and open-end funds for the overall, 4 stars out of 114 for the 3 year period, and 4 stars out of 91 for the 5 year Q4 USCI United States Commodity Index FundSMUSO001572 4/30/18 United States Commodity Index fund (USCI) ( the fund ), is not a mutual fund or any other type of Investment Company within the meaning of the Investment Company Act of 1940, as amended, and are not subject to regulation thereunder. Commodity and futures trading is highly speculative and generally volatile and are not suitable for all investors.
6 The fund is speculative and involves a high degree of risk. An investor may lose all or substantially all of an investment in the fund . Please review the prospectus for the breakeven calculations for the Funds. Ordinary brokerage commissions apply. Shares of the fund are not FDIC insured, may lose value and have no bank guarantee. Indexes are unmanaged and do not reflect the deduction of any fees, expenses or taxes; individuals cannot invest directly in an Index . Only authorized purchasers may purchase or sell directly with USCI, in minimum blocks of 50,000 shares. USCI s share price may not closely track the SDCITR, the price of the futures contracts in the SDCITR, the spot prices of these commodities, or the NAV of fund is not operated in a fashion such that its NAV will reflect the percentage change of the price of any particular futures contract as measured over a time period greater than one day.
7 It is not the intent to operate the fund in a fashion such that its NAV will equal, in dollar terms, the spot price of any particular futures will be available for tax reporting purposes. You may download them electronically through a link on the fund s Optimum Yield Diversified Commodity Index Total Return (DBLCDBCT) a rules-based Index composed of futures contracts on 14 of the most heavily traded physical Commodity Index Total Return (BCOM TR) is an Index that tracks the performance of 22 broadly diversified Commodity futures contracts. Prior to July 1, 2014, BCOM was known as the Dow Jones-UBS Commodity Index .
8 S&P Goldman Sachs Commodity Index Total Return (SPGSCI TR) is a composite Index representing the unleveraged, long-only performance of a diversified group of Commodity futures contracts. The returns are calculated on a fully collateralized basis with full International Commodity Index - (RICIGL TR) is an Index of 37 commodities futures contracts based on global consumption and describes a futures market where the prices of futures contracts, charted over a period of time, are downward sloping. As the contracts near expiration the prices tend to a market price condition where the price of the futures contract that is nearest to expiration is lower than the next contract s a statistical measurement of how closely two securities have moved together.
9 CPI the Consumer Price Index (CPI) is a weighted average of the price of a basket of goods, used to measure the cost of living and is an indicator of is a statistical measurement that refers to the amount of uncertainty or risk about the size of changes in a given security or market Morningstar Rating is provided for those exchange-traded funds ( ETFs ) with at least a three-year history. Ratings are based on the ETF s Morningstar Risk-Adjusted Return measure which accounts for variation in monthly performance, placing more emphasis on downward variations and rewarding consistent performance. An ETF s risk-adjusted return includes a brokerage commission estimate.
10 This estimate is intended to reflect what an average investor would pay when buying or selling an ETF. NOTE, this estimate is subject to change and the actual brokerage commission an investor pays may be higher or lower than this estimate. Morningstar compares each ETF s risk-adjusted return to the open-end mutual fund rating breakpoints for that category. Consistent with the open-end mutual fund ratings, the top 10% of ETFs in each category receive 5 stars, the next receive 4 stars, the next 35% receive 3 stars, the next receive 2 stars and the bottom 10% receive 1 star. The overall rating for an ETF is based on a weighted average of the time-period ratings ( , the ETF s 3, 5, and 10 year rating).