Transcription of Smart Grid Top Markets Report
1 Smart grid Top market Report , Update January 2017 1 Department of Commerce | International Trade Administration | industry & Analysis Smart grid Top Markets Report Update, January 2017 This Update highlights trends to watch in 2017 for exporters and offers an expanded look at the top 50 Markets for electricity transmission, distribution, and storage exports. Also included are the first ever energy storage sub-sector rankings for exporters. The full 2016 Smart grid Top Markets Report , including rankings of 34 Markets and country case studies, is available at Stay tuned for the fully expanded 2017 Report release in late 2017! Digitalization is on the rise, utilities are facing revenue losses from grid defection and net metering, renewable energy deployment is outpacing other energy forms, oil prices have remained low, and global economic growth has remained stagnant.
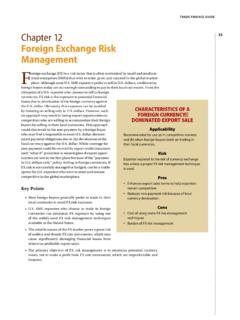
2 In 2016, the global Smart grid sector continued a trajectory of embracing industry -wide change, or the so-called energy transition, and opportunities for exporters to provide solutions to the resulting challenges remain strong heading into 2017 and beyond. To reflect these growing market opportunities, ITA has expanded its 2016 Smart grid Top Markets Report assessment in this Update from 34 to 50 Markets . The analyses and rankings included in this Interim Brief consider the near-term growth potential for exporters of Smart grid products and services overall and for three sub-sectors (Figure 1): transmission and distribution (T&D) equipment, Smart grid information communications technologies (ICT), and energy storage.
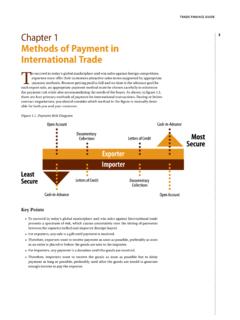
3 Figure 1. Smart grid industry Taxonomy Smart grid Top market Report , Update January 2017 2 Department of Commerce | International Trade Administration | industry & Analysis The Update overall Smart grid rankings are shown in Figure 2. The methodology for these rankings is similar to previous rankings. However, a new, fifth category Energy Storage Growth Potential is included in these rankings for the first time, where further information on its methodology can be found later in the Update. The overall Smart grid rankings relative to the sub-sector rankings (presented on subsequent pages) reflect variations in weighting among five categories: 1. Smart grid market Growth Potential (30 percent): industry data and information on policies, regulations, and other local drivers of the Smart grid technologies and services market .
4 2. Trade Factors and Competitiveness (30 percent): Trade data and other information on exports of T&D equipment products and services in a given market . 3. Energy Storage Growth Potential (10 percent): Energy storage deployment and information on renewable energy deployment and other drivers for the energy storage system market . 4. Key Economic and Energy Sector Investment Indicators (20 percent): Broader economic data and power sector trends that impact investment in electricity infrastructure, and the development and growth of the Smart grid in a given market . 5. Strength of Domestic industry (10 percent): Trade data and other information on the extent to which demand for Smart grid technology and services will be met by the domestic industry as opposed to international trade in a given market .
5 Drivers for the deployment and development of grid modernization equipment, technology, and services vary by region and sub-sector with a wide range of Markets offering business opportunities. ITA evaluated 146 countries globally for data set availability, current export market size, and government strategic engagement and Commercial Service presence to expand the number of countries included in the Report to 50 up from 34 in 2016 and 32 in 2015. As shown in Figure 2, new Markets were added from almost every continent and across a spectrum of economic status. These included: Argentina, Belgium, Bulgaria, Costa Rica, Czech Republic, Egypt, Ethiopia, Finland, Ghana, Ireland, Kazakhstan, Kenya, Morocco, Nicaragua, Peru, and Romania.
6 The absence of some Markets from this Update is not necessarily indicate a lack of opportunities in such Markets for exporters. For example, Venezuela and Ecuador were not included in the rankings because of a lack of available data sets, despite being top destinations by revenues for T&D equipment exports. The United States nearest neighbors topped the Update overall rankings and demonstrated the strong integration of Smart grid technologies across North America. Mexico has continued an upward trajectory in the rankings, thus reflecting that the reforms are creating new opportunities. Similarly, India rose again, year-on-year, in the overall rankings driven by government commitment to electrification and overall sector high-growth potential.
7 Korea, Chile, and Egypt (new in 2017) replaced China, Vietnam, and France in the top ten overall. Nigeria, Spain, and China saw drops in their Key Economic and Energy Sector Investment Indicator scores, while Korea and Thailand saw increases. In the case of Nigeria, much of this can be attributed to economic recession that plagued its economy in 2016 as income from oil revenues continued to drop. Given the number of Markets included in this Report , which expanded by almost 50 percent, further direct year-on-year comparisons are difficult. Additional analysis effecting market rankings is discussed at the sub-sector levels below. Figure 2. Overall Smart grid Rankings 1 Mexico11 China21 Denmark31 Nigeria41 Costa Rica2 Canada12 Germany22 Singapore32 Italy42 Morocco3UK13 Ireland23 Turkey33 Israel43 Ghana4 India14 Vietnam24 Sweden34 Thailand44 Romania5 Australia15 Malaysia25 Kenya35 Brazil45 Peru6 Korea16 Philippines26 Spain36 Argentina46 Bulgaria7 Japan17 Indonesia27 Ethiopia37 Colombia47 Nicaragua8 Egypt18 France28 Poland38 South Africa48 New Zealand9 Saudi Arabia19 Finland29 Austria39 Portugal49 Russia10 Chile20 Netherlands30 Belgium40 Czech Republic50 KazakhstanSmart grid Top market Report .
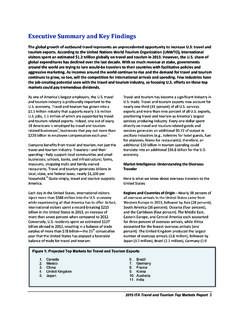
8 Update January 2017 3 Department of Commerce | International Trade Administration | industry & Analysis Transmission & Distribution Equipment Sub-Sector Global trade in transmission and distribution (T&D) equipment has remained relatively stable over the last few years even as global electricity demand has incrementally increased amid stagnant global economic In the near-term, average global electricity annual demand is expected to more than double from percent per year in 2015 to percent by This is expected to drive approximately $5 trillion in investment in T&D infrastructure from T&D equipment exports have performed well in recent years. As shown in Figure 3, after recovering from a drop in global market share, T&D equipment exports have increased steadily since 2008 relative to global competitors.
9 Exporters captured over 9 percent of the global market share in 2015 the highest share in over a decade. This stands in contrast to other developed countries such as Germany, Japan, and Italy that have conceded export market share, while market share in countries such as China and Korea has risen. Total export revenues for the T&D equipment sub-sector reached nearly $ billion in Across this suite of T&D equipment products, five categories accounted for more than 50 percent of the total export revenue (Figure 4). Exports to Canada and Mexico accounted for almost 45 percent of this total, and the top ten Markets make up over two-thirds of total exports, shown in Figure 5. 1 United Nations Statistical Office, based on the Harmonized Tariff System (HTS) for the classification of trade commodities (based on 16 products at the six-digit level) via the Trade Policy Information System of the Department of Commerce: International Trade Administration (ITA).
10 Data is as reported by country and accessed December 2016 with data not available for all nations. 2 Business Monitor International, Ltd, 2016. 3 International Energy Agency (IEA), World Energy Outlook, 2015. 4 Census Trade Data (based on 23 product codes at the ten-digit level) via the Trade Policy Information System of the Department of Commerce: International Trade Administration. Figure 3. Global T&D Equipment Exports, By Year1 Smart grid Top market Report , Update January 2017 4 Department of Commerce | International Trade Administration | industry & Analysis Turning to near-term growth opportunities for exporters, the T&D equipment sub-sector rankings focus on Markets with high growth in the products and services necessary for the build-out, modernization and automation of T&D networks.