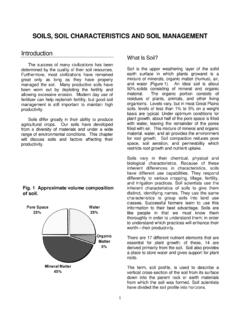
Transcription of Soil Texture % Sand % Silt % Clay Range CEC 3 weight ...
1 Section 2 of 22 (2c - Soils Data Interpretation Table for IWM Planning). soil Unavail-able Available soil (meq/100g). (Million lbs. CEC Range soil weight % Sand % Clay per ac-ft). Solids Water Water Porosity Density % Silt (g/cm3). Bulk at FC. soil Texture % % % %. Vol. in/ft Vol. in/ft Vol. in/ft Vol. in/ft Sands 86 - 98 2 - 14 2-8 2 6 Loamy Sands 72 - 88 2 - 28 2 - 14 Fine Sands 86 - 98 2 - 14 2-8 V. F. Sands 86 - 98 2 - 14 2-8 Loamy F. Sands 72 - 88 2 - 28 2 - 14 Loamy V. F. Sands 72 - 88 2 - 28 2 - 14 Sandy Loam 46 - 84 2 - 48 2- 18 Fine Sandy Loam 3 8 46 - 84 2 - 48 2 - 18 V. F. Sandy Loam 46 - 84 2 - 48 2 - 18 Loam 26 - 50 30 - 48 10 - 26 7 15. Silt Loam 2 - 48 52 - 78 2 - 26. Silt 10 19 2 - 18 82 - 98 2 - 10 Sandy Clay Loam 46 - 78 2 - 26 22 - 36 Silty Clay Loam 2 - 18 42 - 70 28 - 38 Clay Loam 22- 44 18 - 50 28 - 38 Sandy Clay 46 - 62 2 - 16 38 - 54 Silty Clay 2 - 18 42 - 58 42 - 58 Clay 2 - 44 2 - 38 42 - 98 15 - 30. V = Very & F = Fine Bulk Density (Ref.)
2 Bulk density calculator @ ). Particle diameter (mm) for Sand, Silt & Clay: Very Coarse Sand ( - Unavailable Water (Ref. Figure 1-9 of the National Engineering ), Coarse Sand ( - ), Med. Sand ( - ), Fine Sand ( - Handbook; Section 15 Irrigation). ), Very Fine Sand ( - ), Silt ( - ) and Clay (< ) Available Water (Ref. NRCS Salinity Management for soil . Cation Exchange Capacity (CEC) taken from the Western Fertilizer Table , page ). Handbook, 2nd ED., 1995 FC = Field Capacity. NOTE: soil structure is evaluated for its effect on downward movement of water: Single grain (rapid), Granular (rapid), Blocky (moderate), Prismatic (moderate), Platy (slow) and Massive (slow). The soil Intake Family (typically thru ) is used in IWM field evaluations and irrigation system design. Irrigation Water Quality ( , Electrical Conductivity of irrigation water (ECiw) in dS/m & Sodium Adsorption Ratio (SAR)) is evaluated for its potential detrimental effects on plant moisture availability and water infiltration.
3 Agronomy Tech Note 76 ( ).