Transcription of Solar PV Manufacturing Cost Analysis - NREL
1 nrel is a national laboratory of the Department of Energy, Office of Energy Efficiency and Renewable Energy, operated by the Alliance for Sustainable Energy, LLC. Solar PV Manufacturing cost Analysis : Competitiveness in a Global Industry Stanford University: Precourt Institute for Energy Alan Goodrich , Te d James , and Michael Woodhouse October 10, 2011 Corresponding authors: nrel /PR-6A20-53938 2 Analysis Disclaimer DISCLAIMER AGREEMENT These Manufacturing cost model results ( Data ) are provided by the National Renewable Energy Laboratory ( nrel ), which is operated by the Alliance for Sustainable Energy LLC ( Alliance ) for the Department of Energy (the DOE ).
2 It is recognized that disclosure of these Data is provided under the following conditions and warnings: (1) these Data have been prepared for reference purposes only; (2) these Data consist of forecasts, estimates or assumptions made on a best-efforts basis, based upon present expectations; and (3) these Data were prepared with existing information and are subject to change without notice. The names DOE/ nrel /ALLIANCE shall not be used in any representation, advertising, publicity or other manner whatsoever to endorse or promote any entity that adopts or uses these Data. DOE/ nrel /ALLIANCE shall not provide any support, consulting, training or assistance of any kind with regard to the use of these Data or any updates, revisions or new versions of these Data.
3 YOU AGREE TO INDEMNIFY DOE/ nrel /ALLIANCE, AND ITS AFFILIATES, OFFICERS, AGENTS, AND EMPLOYEES AGAINST ANY CLAIM OR DEMAND, INCLUDING REASONABLE ATTORNEYS' FEES, RELATED TO YOUR USE, RELIANCE, OR ADOPTION OF THESE DATA FOR ANY PURPOSE WHATSOEVER. THESE DATA ARE PROVIDED BY DOE/ nrel /ALLIANCE "AS IS" AND ANY EXPRESS OR IMPLIED WARRANTIES, INCLUDING BUT NOT LIMITED TO, THE IMPLIED WARRANTIES OF MERCHANTABILITY AND FITNESS FOR A PARTICULAR PURPOSE ARE EXPRESSLY DISCLAIMED. IN NO EVENT SHALL DOE/ nrel /ALLIANCE BE LIABLE FOR ANY SPECIAL, INDIRECT OR CONSEQUENTIAL DAMAGES OR ANY DAMAGES WHATSOEVER, INCLUDING BUT NOT LIMITED TO CLAIMS ASSOCIATED WITH THE LOSS OF DATA OR PROFITS, WHICH MAY RESULT FROM AN ACTION IN CONTRACT, NEGLIGENCE OR OTHER TORTIOUS CLAIM THAT ARISES OUT OF OR IN CONNECTION WITH THE USE OR PERFORMANCE OF THESE DATA.
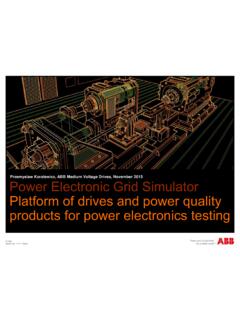
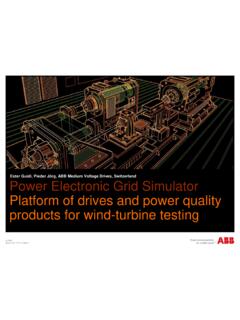
4 2 3 Si Solar Manufacturing Supply Chain Capital equipment Raw materials Intermediate products Poly Si Ingot Wafer Cell Module System 4 US-China Solar Energy-Related Trade Flows Source: GTM Research and International Trade Commission. (2011). International Trade Assessment 2011: Trade Flows and Domestic Content for Solar energy-related Goods in the United States. 5 PV Module Trade Flows Source: GTM Research and International Trade Commission. (2011). International Trade Assessment 2011: Trade Flows and Domestic Content for Solar energy-related Goods in the United States. Solar PV Market Developments 7 Global Position Ceded to China & Taiwan Between 2000 and 2010 global shipments grew 53% (CAGR) market share slipped from 30% to 7% (30% CAGR) China/Taiwan grew from <2% to 54% (115% CAGR) Sources: nrel chart using data from Mints, P.
5 ; Donnelly, J. (2011). Photovoltaic Manufacturer Shipments, Capacity and Competitive Analysis 2010/2011. Report NPS-Supply 6, Navigant Solar Services Program. Palo Alto, CA. 0%10%20%30%40%50%60%02000400060008000100 0012000140001600018000200001995199619971 9981999200020012002200320042005200620072 00820092010 Market Share PV Cell/Module Shipments (MWp DC) and China & Taiwan Market Share of Global Shipments of PV Cells/Modules Rest of WorldChina & MarketshareChina & Taiwan Marketshare8 China Solar PV: Export Driven Meager domestic demand belies China s dominant production GWP DC shipments vs. GWP DC installed Sources: nrel chart using data from European Photovoltaics Industry Association (EPIA).
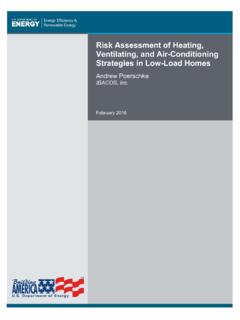
6 Global Market Outlook for PV until 2015. Trina Solar (August 23, 2011). Q2 2011 Supplemental Earnings Presentation. 9 China s Focused Growth: (4) Key Players, All Si Growth enabled by access to low cost debt, technology diffusion Sources: Mints, P.; Donnelly, J. (2011). Photovoltaic Manufacturer Shipments, Capacity and Competitive Analysis 2010/2011. Report NPS-Supply 6, Navigant Solar Services Program. Palo Alto, CA. de la Tour et al. (2011). Innovation and international technology transfer: The case of the Chinese PV industry, Energy Policy 39 (2011) 761-770. 10 Diversity vs. China Manufacturing Scale Sources: Mints, P.
7 ; Donnelly, J. (2011). Photovoltaic Manufacturer Shipments, Capacity and Competitive Analysis 2010/2011. Navigant Solar Services Program. Palo Alto, CA. Wafer silicon is >85% of the global market 582 MWP DC 487 MWP DC 9,269 MWP DC 50 MWP DC private investors encourage technology differentiation opportunities for producers of innovative Thin Film PV technologies China s government-backed investors fund more mature technologies opportunities for w-Si technologies (quick scale-up; wages, exports) 11 Capital Sources Drive Solar Technology Mix Sources: Graphic Bloomberg NEF (4/9/10, 4/16/10, 11/8/10, & 3/16/11); J.
8 Silver Testimony before the Subcommittee on Oversight and Investigations Committee on Energy and Commerce, House of Representatives (September 14, 2011) 2009 ARRA Manufacturing Tax Credit (section 48C): "..have the greatest potential for technological innovation and commercial deployment. Energy Policy Act of 2005 ( 1703 Innovative Technology LG Program): "..employ new or significantly improved technologies as compared to commercial technologies. Recovery Act of 2009 ( 1705 Temporary LG Program for Deployment of Renewable Energy) Amended EPAct 1703; Expired September 30, 2011. The (Loan Guarantee) program was designed to provide support to these cutting edge industries, which have great potential to create jobs in whatever country wins the clean energy race, but also involve technology and market risks that private sector lenders often cannot or will not underwrite.
9 Jonathan Silver, Executive Director LPO, DOE 12 Best Research (Laboratory) Cell Efficiencies Single junction wafer Si approaching practical performance limit Challenge facing thin films: closing the gap between laboratory and production devices 13 Private Investors Value Thin Film PV Potential Thin Film PV technologies seek to close the gap: innovative, disruptive Startups raise capital based on defensible, disruptive IP position = 12%; Leading commercial Thin Film PV module (2011) = 20%; Leading commercial wafer Si PV module (2011) Sources: Goodrich, A.; James, T.; Woodhouse, M. (2011). Drivers of Residential and Utility Scale Solar Photovoltaic (PV) System Price.
10 In the nrel Technical Report. Golden, CO: National Renewable Energy Laboratory ( nrel ). Lab CIGS cell: >20% Lab Si cell: ~25% International Investment Risk 15 Other Investment Risk Considerations Country Political and economic stability Status, procedures, and maturity of legal system Transparency of business dealings Economic Expected inflation Local regulation Currency High cost and reliability of derivatives and other hedging instruments, particularly in emerging markets Security IP protection Property ownership, including the ability of creditors to repossess assets Financial Interest rates Insurance (business interruption)