Transcription of Solubility of NaCl, NaBr, and KCl in Water ... - Senior Chem
1 Solubility of NaCl, NaBr, and KCl in Water , Methanol, Ethanol, andTheir Mixed SolventsSima o P. Pinho and Euge nia A. Macedo*Laboratory of Separation and Reaction engineering , Departamento de Engenharia Qu mica,Faculdade de Engenharia, Rua do Dr. Roberto Frias, 4200-465 Porto, PortugalThe solubilities of sodium chloride, sodium bromide, and potassium bromide in the solvents Water ,methanol, ethanol, and methanol+ethanol as well as those of sodium bromide in Water +methanol andsodium bromide and potassium chloride in Water +ethanol mixed solvents were measured in the rangebetween and K using an analytical gravimetric method. When possible, the reliability ofthe method was checked by comparing the experimental data with literature values. The method provedto be very accurate, and the solubilities are generally reproducible when compared to the data reportedin the study of phase equilibria in salt-containing systemsis very important for many industrial applications.
2 Moreparticularly, a knowledge of accurate solubilities is neededfor the design of separation processes such as extractivecrystallization1or for the safe operation of different pro-cessing units such as distillation columns, absorption units,and extraction can also be useful for theoreti-cal studies relating Solubility to ionic radii or other possiblesolvation parameters3and for calculating the salt solubilityproduct or the ion-pair association constants applying thePitzer-Simonson4or the for aqueous electrolyte systems Solubility isgenerally available for many salts, namely, in the compila-tion books by Stephen and Stephen6,7or Linke and Seidell,8,9for organic solvents or aqueous-organic mixed solventsdata is very scarce, obsolete, or not available at , a program for systematic measurements wasimplemented to measure the Solubility of NaCl, NaBr, KCl,and KBr in the temperature range between K in the pure solvents Water , methanol, andethanol, and their binary mixed solvents over the wholesolvent composition range.
3 Because some of the experi-mentally measured solubilities had already been pub-lished,10,11in this work the final series of measurementsis all experiments, distilled deionized waterwas used. All other chemicals were supplied by Merck; saltsNaCl, KCl, and NaBr with a purity higher than andsolvents methanol and ethanol with a minimum purity were employed with no further purification. To avoidwater salt contamination, salts were dried at K ina drying stove for more than 2 days before detailed description of the procedure hasbeen presented,11so only a brief explanation of the analyti-cal gravimetric method used to perform the measurementsis given. The method consists on the preparation of asaturated solution at constant temperature (( K). Theequilibrium cell is charged with known masses (( mg)of all components, and to reach solution equilibriumconditions, stirring is carried out for at least3hattheworking temperature.))
4 Then the solution is allowed to settleat least1/2h before sampling with a heated syringe. Thetotal solvent evaporation is achieved in two stages. Initially,the samples are placed on a heating plate, enhancing theformation of salt crystals, which are then completely driedin an oven at K. The samples remain in the ovenfor more than 3 days and are then cooled in a drier withsilica gel for 1 day. Finally, they are weighed, and theprocess is regularly repeated until a constant mass isachieved. Each experimental point is an average of at leastthree different measurements obeying one of the followingcriteria. If the Solubility is higher than 10 (mass percent),then the quotient{2s}/{ Solubility } 100 should be lessthan , wheresis the standard deviation within a set ofdifferent experimental results. If the experimental solubil-ity is less than 10%, then this criterion is difficult to attain,and instead the standard deviationsshould be less and DiscussionBinary Table 1, the measured solubilitiesof the salts in Water , methanol, and ethanol at differenttemperatures are reported.
5 The Water +salt systems werestudied in a temperature range between and , whereas for systems with methanol the maximumtemperature is K. The ethanol+salt systems werestudied at only three different temperatures: , , and K because the salt solubilities are toolow or the temperature dependence is not quality of the measured data may be investigatedby comparing it with literature values reported in thecompilation books6-9and in the open literature; for thewater+salt binary systems, the comparisons can be easilydone because of the extensive amount of published some cases, the amount of consistent data presented inthe compilation books is enough to make an average curvefit for a better graphical comparison with the more recently* Corresponding author. E-mail: Fax:+351225081674. Present address: Escola Superior de Tecnologia e de Gesta o, Campusde Santa Apolo nia, Apartado 1134, 5301-857 Braganc a, Chem.
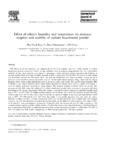
6 Eng. Data2005,50, CCC: $ 2005 American chemical SocietyPublished on Web 11/18/2004published data. That is shown in Figure 1 for the systemswater+NaCl and Water +KCl. From Figure 1, it ispossible to observe the good agreement of the data, even ifthe solubilities measured in this work are systematicallyhigher (around g of NaCl per 100 g of solution) whencompared with the values of Farelo et thedata reported by Farelo and collaborators are clearly inbetter accordance with the average curve, they have usedthe polythermal synthetic method, which is not the mostadequate because the temperature exhibits little influenceon the NaCl seems that this is the mainreason for the unexpected irregular trend shown by theirexperimental data at low temperatures because the solu-bility is almost constant until 300 the solubilities measured here and the onesreported by Farelo et the system Water +KCl atdifferent temperatures, it is possible to observe in Figure1 a better agreement than for the previous system.
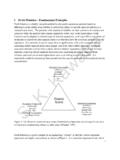
7 Now,the systematically higher deviations do not occur. At lowertemperatures, the Solubility measured in this work is onlyslightly superior, whereas at higher temperatures it isslightly inferior. The solubilities measured by Zhang et a new method combining the polythermal and iso-thermal synthetic methods are also displayed, showinghigher deviations from the average can be observed from Figure 2 for the NaBr+watersystem, it was also possible to find good agreement of thedata measured in this work with the values compiled byLinke an Solubility change with temperatureis very different from that of the precedent systems; up K, the Solubility increase is very evident, but beyondthat value, it is almost constant. The observed breakingbehavior corresponds to a solid-phase transition. Accordingto Rard and Archer,15the transition occurs at K;below this temperature, the solid phase is NaBr 2H2O, andabove it, the solid phase is experimental results measured in this work can beused to estimate the transition temperature by making twolinear fits, one with the experimental results until and the other with the results obtained at temperatureshigher than this one.
8 The intersection of these two linesshould give the transition temperature. Using the datapresented in Table 1, the calculated value for that tem-perature is K, which in comparison with the valuegiven by Rard and Archer15is good support for the qualityof the data measured in this the salt+alcohol systems, it is worthwhilefirst to notice the inverse salt Solubility temperaturedependencesthe salt Solubility decreases with rising tem-perature for salts NaCl in methanol and NaBr in methanoland ethanol. This unusual effect of the temperature on thesolubility, although unforeseen for a given system, may beexplained both by Debye-Hu ckel and ion associationBjerrum theories16because at such low ionic concentrationsthe electrostatic interactions are more pronounced andassociation is favored by the lower dielectric constant. Thiseffect and the change in the association constant withtemperature influence the salt Solubility in organic has already been mentioned that Solubility data ofsalts in alcohols at different temperatures are scarce.
9 Thus,the same kind of comparison as for aqueous systems waspossible only for the system methanol+NaBr. As can beseen from Figure 3, the measured solubilities of NaBr inmethanol reported by Stephen and Stephen6present valuesthat are somewhat different from those obtained in 1. Solubility (Mass Fraction,w) in Pure Solventsat Different Temperatures100 of the Solubility of NaCl (1) and KCl (2)in Water at different temperatures:0, Farelo et al.;12O, Zhang etal.;149, this work. Lines represent average of the Solubility of NaBr (1) in Water atdifferent temperatures:+, Linke and Seidell;8O, this of chemical and engineering Data, Vol. 50, No. 1, 2005 Unfortunately, no reliable or more recent data werefound for that system in order to carry out a better dataevaluation. In this way, a comparison for the solubilitiesvalues at K was done; in the compilation books,6,7that Solubility was found to be between and of NaBr in 100 g of saturated solution, which includesour measured value.
10 This procedure was repeated for allother salt+alcohol systems for which it was possible tofind a much higher Table 2, the measured solubilitiesat and K for NaBr in Water +methanol andfor NaCl, NaBr, and KCl in methanol+ethanol solventsare the methanol+ethanol solvent mixtures, the onlydata set found for comparison was for NaBr at , the values showed high inconsistency for the puresolvents Solubility , and no comparison is presented. There-fore, only for the Water +methanol+NaBr system K is it possible to analyze the data agreement withother sources. In Figure 4, it is possible to observe the goodagreement between our data and that compiled by Stephenand , for that set the reportedsolubility value in pure methanol is, at K, g ofNaBr in 100 g of saturated solution, which is good supportfor our measured data for the Solubility of NaBr in Table 3, the measured solubilities at , ,and K for KCl and NaBr in Water +ethanol solventsare shown.