Transcription of Sources of Flavonoids in the U.S. Diet Using USDA’s Updated
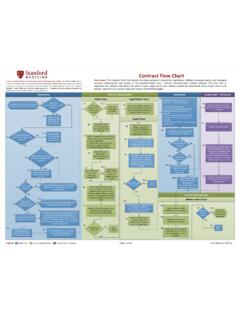
1 Sources of Flavonoids in the Diet Using usda 's Updated Agricultural Database on the Flavonoid Content of Selected Foods. Research Service Haytowitz, , Bhagwat, S., Harnly, J., Holden, , Gebhardt, usda , Agricultural Research Service, Beltsville Human Nutrition Research Center, Nutrient Data Laboratory and Food Composition Laboratory, Beltsville, MD 20705. Abstract Methods Table 3. Flavan-3-ol consumption top 10 Sources NDB No. Description Kg Total Total % of total Discussion Flavonoids are biologically active polyphenolic compounds widely Sources of food composition data: consumed flavan-3-ols flavan-3-ols flavan-3-ols Blueberries are the major source of anthocyanidins in the diet, distributed in plants and have been linked to various Data generated from samples of fruits, nuts and vegetables collected by NDL's National (mg/100 g) consumed (mg) consumed followed by bananas and strawberries (Table 2).
2 Elderberries and chemoprotective effects (Nichenametla et al, 2006). usda first Food and Nutrient Analysis Program and analyzed at usda 's Food Composition Lab in European black currants, not widely consumed in the , are significant 14355 Tea, black, brewed 2393756 27588038224 released a database on the flavonoid content of foods in 2003. The Beltsville, Maryland (Harnly et al, 2006)1 and at the Arkansas Children's Nutrition Center (Wu Sources , containing 769 and 272 mg/100 g respectively. 14352 Tea, black, brewed, decaffeinated 3533556 1875964970 database was recently Updated Using data from usda analysis of 20 et al, 2006)2 were added to the database.
3 Different Flavonoids from a nationwide sampling of 59 fruits, nuts and Several literature databases (CAB Abstracts, Biosis Previews, Agricola, Food Science and 14003 Beer, regular, all 2015774 499912067 Black tea is the both the best source and contributes the highest amount vegetables, providing high quality data not available in the Technology Abstracts) were searched Using key words for Flavonoids . One hundred and two 09016 Apple juice, bottled, unsweetened 5085184 303076960 of flavan-3-ols, contributing 88% of the dietary intake (Table 3). Green earlier database. Data from 102 scientific papers were also added. relevant articles containing analytical data on 26 compounds in edible foods published from 09003 Apples, raw, with skin 3294546 267187700 tea also contains significant amounts of flavan-3-ols (128 mg/100 g), but The new database contains flavonoid data for 395 food items and is 2002 to 2005 were retrieved and added to the 97 articles used in the first release of the 09040 Bananas, raw 3895447 238401351 is not differentiated from black tea in the NHANES as there are not available on NDL's web site ( ).
4 Database for a total of 199. 09050 Blueberries, raw 260462 134685162 important differences in other nutrients. Oolong tea, which is not widely These data were combined with data from NDL's Key Foods list Calculation of consumption data: 09236 Peaches, raw 708517 65112727 consumed in the , is also a significant source of flavan-3-ols (50. derived from consumption data from the National Health and Food intake data from the NHANES3 from 2001-02 were applied against the usda 09252 Pears, raw 644593 43767869 mg/100 g). Nutrition Examination Survey to ascertain the intake of five classes Database of the Flavonoid Content of Selected Foods, Release 2.
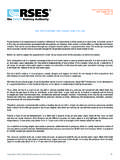
5 09316 Strawberries, raw 546212 25344233 Flavanones are found primarily in citrus products, and oranges and of Flavonoids : anthocyanidins, flavanones, flavonols, flavones, and Recipes from the Food and Nutrient Dataset for Dietary Surveys (FNDDS)4 were broken orange juice provide over 2/3 of the average flavanone intake (Table 4), flavan-3-ols on a population basis. Black tea provided the largest down to their component parts Using the Key Foods process (Haytowitz et al, 2002)5 to followed by other citrus products, such as grapefruit and lemons. The amount of flavonols to the diet (32%), followed by onions (25%). correspond to the NDB Numbers used in the flavonoid database.
6 Table 4. Flavanone consumption top 10 Sources one significant non-citrus item which contributes substantially is tomato, Parsley was the largest contributor of flavones. Dried parsley Grams consumed by the overall population for each item, designated by a NDB Number, NDB Description Kg Total Total flavanones % of total which, while containing a relatively small quantity of flavonones, is widely contains a large amount g/100g, though rarely is 100g were calculated and multiplied by the sum of each individual flavonoid by subclass (Table 1) No. consumed flavanones consumed (mg) flavanones consumed. consumed at one time; a teaspoon weighs Oranges (53%) and to generate Tables 2 6.
7 (mg/100 g) consumed grapefruit juice (16%) contributed significant amounts of the 09200 Oranges, raw 1276152 543257895 Parsley, both fresh and dried, contains very high amounts of 1 Harnly, , Doherty, , Beecher, , Holden, , Haytowitz, , Bhagwat, S., Gebhardt, S. 2006. flavanones. Brewed tea provides the largest quantities of flavan-3- 09123 Grapefruit juice, white, canned 838092 161081205 flavones(Table 5), and, as a result, contributes significant amounts of Flavonoid Content of Fruits, Vegetables, and Nuts. J. Agric. Food Chem. (Submitted). ols to the diet. Blueberries contributed the largest amount of flavones to the diet, though they are used in relatively small quantities, 2 Wu, X.
8 , Beecher, , Holden, , Haytowitz, , Gebhardt, , and Prior, 2006. Concentration of 09215 Orange juice, frozen 328229 96761810 anthocyanidins (31%), followed by bananas (21%) and strawberries ,1 teaspoon of dried parsley = anthocyanins in common foods in the United States and estimation of normal consumption. J. Agric. Food Chem. concentrate, reconstituted (14%). Even though bananas contain considerably less 54:4069-4075. 09206 Orange juice, raw 355454 48412874 Tea and onions together provide over of the flavonol intake (Table 6). anthocyanidins than any of the berries, consumption of 3 National Center for Health Statistics (NCHS), CDC, DHHS.
9 2004. NHANES 2001-2002 Data Files: Data, Docs, 09150 Lemons, raw, without peel 93780 46711831 Other foods providing significant amounts of flavonols are yellow wax bananas is much higher than that of individual berries. Daily per Codebooks, SAS Code. NHANES Web site: peppers (51 mg/100 g), ancho peppers (28 mg/100 g), and canned kale 11529 Tomatoes, red, ripe, raw 3986593 27108833 capita intake of Flavonoids in the Using these data was: (accessed 11/04). (22 mg/100 g). 09126 Grapefruit juice, white, frozen 83400 26003990 anthocyanidins, 5 mg; flavanones, 4 mg; flavones, 1 mg; flavonols, Department of Agriculture ( usda ), Agricultural Research Service, 2004.
10 usda Food and Nutrient concentrate, reconstituted Total per capita consumption of the five flavonoid subclasses is 132 mg/d 10 mg; and flavan-3-ols, 112 mg. This expanded database provides Database for Dietary Studies, Food Surveys Research Group Home Page, researchers with new values on the flavonoid content of many more 09153 Lemon juice, canned or bottled 103927 24932087 (Table 7) with flavan-3-ols providing the largest proportion, followed by foods in order to better ascertain the impact of flavonoid 5. 09218 Tangerines, raw 135645 24361862 the flavonols. This compares to 79 mg per day for the five flavonoid Haytowitz, , Pehrsson, , Holden, 2002.