Transcription of SOUTH AFRICAN POULTRY MEAT IMPORTS
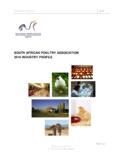
1 1 PLEASE NOTE: This report is based on SARS verified stats. The verified stats will be corrected up to two years in arrears. Where the term POULTRY is used, this may refer to IMPORTS of chicken, turkey, duck, goose or guinea fowl. If, as a regular user of this report, you would like other data included or data presented in a different format ( tables), please contact us on with your suggestions. 1. IMPORTS FOR 2018 POULTRY IMPORTS for 2017 totalled 556 877 t (- % on 2016). IMPORTS in 2018 (566 210 t) are up % on 2017 . IMPORTS for 2018 were up 19 % over the 5-year average for POULTRY IMPORTS (2013 2017 ). The contributions from the major importing countries are shown in Graph 1: Brazil States 1: Country of origin for POULTRY IMPORTS (2018) SOUTH AFRICAN POULTRY MEAT IMPORTS : COUNTRY REPORT JANUARY 2019 Any and all information, data, know-how, documentation, materials and other communications, written or oral, which are disclosed or provided to SAPA or its designees by a SAPA member shall be regarded as confidential information belonging to that member and will not be disclosed to any other member.
2 2 Brazil was the main country of origin in 2018, accounting for %, or 348 155 t, of total POULTRY IMPORTS into SOUTH Africa. With AI affecting EU trade, the US was the second largest importer into the country, with % or 91 374 t. Argentina and Thailand increased exports to SOUTH Africa in the absence of many of the EU nations, to account for % (33 278 t) and % (9 011 t) of 2018 IMPORTS , respectively. Of the EU exporters, only Ireland, Denmark, Poland and Spain exported significant quantities to SOUTH Africa in 2018: 26 328 t ( %), 25 672 ( %), 13 463 t ( %) and 4 932 t ( %), respectively. Canadian exports to SOUTH Africa dropped compared to 2017 (7 305 t; % of total). All other importing countries contributed only % to IMPORTS of POULTRY into SOUTH Africa in 2018. If the EU countries are considered as a single entity, % of POULTRY IMPORTS entered SA through the EU in 2018, compared to % in 2017 and % in 2016.
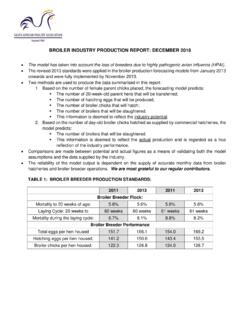
3 This drop in 2018 reflects the impact of the trade bans on EU countries affected by avian influenza. In Graph 2, the EU countries are grouped together as a single entity. 2. MONTHLY IMPORTS FOR JANUARY 2019 POULTRY IMPORTS into SOUTH Africa totalled 35 174 tonnes in January 2019. Since December 2016, Brazil has been the main country of origin for SOUTH AFRICAN POULTRY IMPORTS , with the exception of March 2017 when the States landed over 25 000 t of POULTRY products here. In January 2019, Brazil accounted for % or 19 219 t of total IMPORTS (Graph 3); cf just % of total IMPORTS back in March 2017 . Poland has crashed back into the SOUTH AFRICAN POULTRY market over the past 6 months. In January, Poland moved up to second place on the IMPORTS table with 4 410 tonnes of POULTRY products ( %).
4 Under the terms of the AGOA agreement, the US may export 65 000 tonnes of bone-in frozen chicken per annum to SOUTH Africa, free from anti-dumping duties (cycle April to March). The US slides to third place on the IMPORTS table in January, with 4 098 tonnes ( % of IMPORTS ). The EU is beginning to claw its way back into the SOUTH AFRICAN market: besides Poland, Ireland landed 1 751 t ( %) in January; Denmark 1390 t ( %) and Spain 978 t ( %). Brazil States 2: Country of origin 2018 (EU countries grouped) 3 Avian influenza reduced Dutch, French, German, Hungarian and UK IMPORTS to almost nothing for most of 2018. Belgium has sent POULTRY products for the first time in over a year this month and small volumes are arriving from the UK, France and Germany. No IMPORTS were received from the Netherlands this month.
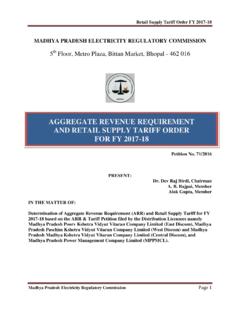
5 Argentina accounted for % (1 275 t) of IMPORTS in January; Thailand % (892 t), Canada % (776 t) and Chile % (269 t), respectively (see Graphs 3 and 4). Collectively, other countries contributed %. Brazil States 3: POULTRY IMPORTS for January 2019 Brazil States < %Graph 4: POULTRY IMPORTS for January 2019 (EU countries grouped) 4 Graph 4 (above) shows the origin of POULTRY IMPORTS in January 2019, with the EU countries grouped together as a single entity. IMPORTS from the EU contributed % (8 645 t) of total POULTRY IMPORTS into SOUTH Africa in January (cf % in November 2016). EU tonnages were up % on a monthly basis and are up % on a year-on-year basis. There is clear evidence that the EU is beginning to erode Brazilian market share in 4Q 2018 and 1Q 2019.
6 Most European HPAI events are now considered resolved (OIE), at least amongst the countries exporting to SOUTH Africa. However, Denmark has reported HPAI in wild birds in January 2019. COUNTRIES OF ORIGIN POULTRY IMPORTS from Brazil POULTRY IMPORTS from Brazil totalled 19 219 t in January 2019, representing % of total POULTRY IMPORTS in volume terms, with an FOB import value of million. On a monthly basis, IMPORTS from Brazil decreased by % (- 2 418 t). IMPORTS decreased by % (- 7 938 t) compared to January 2018. POULTRY IMPORTS from Brazil for January 2019: Tariff Description Import Quantity in kg FOB Import Price in R Unit Price in R per kg Chicken: Not cut in pieces, Frozen Mechanically Deboned Meat 12 677 433 R 107 398 969 R Carcasses (excluding necks and offal) with all cuts ( thighs, wings, legs and breasts) removed 74 808 R 237 994 R Chicken: Not cut in pieces, frozen, whole and half chickens 189 409 R 3 112 806 R Chicken: Boneless cuts: Breasts 604 167 R 14 174 350 R Chicken: Boneless cuts: Other 53 325 R 961 407 R Chicken: Offal: Livers 111 500 R 590 939 R Chicken: Offal: Feet 1 173 420 R 12 919 754 R Chicken: Offal: Other 1 000 110 R 3 059 296 R Chicken: Other: Leg quarters 2 307 041 R 31 184 762 R Chicken: Other: Wings 27 000 R 193 256 R Chicken: Other.
7 Drumsticks 185 706 R 3 509 621 R Chicken: Other: Other 460 210 R 2 560 977 R Turkey: Cuts and offal, frozen; Frozen Turkey portions and MRM 330 297 R 5 369 007 R Ducks, Other, frozen 24 405 R 1 519 763 R Total for: Brazil in January 2019 19 218 831 R 186 792 901 R \ Brazilian IMPORTS in January 2019 included % mechanically deboned meat; % chicken offal and carcasses; % frozen chicken bone-in leg quarters; % other frozen chicken portions (drumsticks, wings, other); % frozen boneless chicken portions; % whole frozen chickens and % turkey meat. Brazilian IMPORTS included a small amount of duck products. Back in December 2016, Brazilian IMPORTS comprised just % bone-in chicken portions. In January 2019, this figure is % (from a high of % in February 2018).
8 IMPORTS of bone-in chicken are beginning to revert to the EU, as HPAI-related trade bans are lifted. Graph 5 shows the monthly IMPORTS (t) from Brazil, since January 2015: 5 Accumulated IMPORTS in December 2018 (348 155 t) were % higher than in December 2017 (Graph 6). 06 00012 00018 00024 00030 00036 000 Jan-15 Mar-15 May-15 Jul-15 Sep-15 Nov-15 Jan-16 Mar-16 May-16 Jul-16 Sep-16 Nov-16 Jan-17 Mar-17 May-17 Jul-17 Sep-17 Nov-17 Jan-18 Mar-18 May-18 Jul-18 Sep-18 Nov-18 Jan-19 TonnesGraph 5: POULTRY IMPORTS from BrazilJanFebMarAprMayJunJulAugSepOctNovD ec201619 11036 22559 58478 013101 536124 429145 225162 595183 621204 275218 854233 787201721 02740 95465 86090 603118 606142 380175 597209 740244 564279 090308 497337 476201827 15751 76784 038116 607148 335171 473203 527239 308272 451301 471326 518348 155201919 219050 000100 000150 000200 000250 000300 000350 000 TonnesGraph 6: Accumulation of POULTRY IMPORTS from Brazil 6 Quarterly POULTRY IMPORTS from Brazil.
9 Mechanically deboned meat ( ) made up % (38 186 t) of all IMPORTS originating from Brazil during the 4Q 2018 (total: 75 704 t). During 4Q 2018, the remainder of Brazilian IMPORTS included % frozen offal ( *); % bone-in chicken portions (23 618 tonnes; *); % frozen turkey portions and MDM ( ); % frozen boneless chicken portions ( *); % frozen chicken carcasses; % whole frozen chicken ( ) and % other (Graph 7). POULTRY IMPORTS from the EU Graph 8 depicts the total monthly POULTRY IMPORTS from the European Union from January 2015 to January 2019. During January 2019, 8 645 t of POULTRY IMPORTS entered the country from the EU; this is % more than in December 2018 (+ 576 t). EU IMPORTS represent % of total POULTRY IMPORTS in January. IMPORTS from individual EU countries, with notable tonnages, are shown in Graph 9.
10 Seven EU nations sent product in excess of 1 tonne to SOUTH Africa in January. January 2019 IMPORTS from the EU are up % (+ 3 470 t) on January 2018 IMPORTS but remain % below the record EU IMPORTS received in November 2016. Chicken: Frozen Chicken: Chicken: Whole, * Chicken: Boneless portions, * Chicken: Offal, * Chicken: Bone-in portions, Turkey: Whole, Turkey: Frozen 7: POULTRY IMPORTS from Brazil for Q4 2018 7 The contribution of the EU to total POULTRY IMPORTS reached 60 % in November 2014 (Graph 10) before the HPAI outbreaks of 2015. EU tonnages rose strongly again through 2016 as the bloc recovered from the epidemic, hitting 63 % of total IMPORTS in November 2016. IMPORTS dropped dramatically from December 2016 in response to new AI-related trade bans.