Transcription of South Sudan - United Nations University
1 1 South Sudan MIGRATION PROFILE Study on Migration Routes in the East and Horn of Africa August 2017 I Contents List of Figures .. I List of Tables .. I 1. Introduction .. 1 2. Forced Migration/ Displacement .. 3 Refugees in South Sudan .. 3 Refugees from South Sudan .. 4 Internal Displacement in South Sudan .. 5 3. Regular/ Labour Migration .. 5 Immigration .. 5 Emigration .. 6 4. Internal Migration .. 6 5. Irregular Migration .. 6 Human Smuggling .. 7 Trafficking in Human Beings .. 7 6. Migrants Vulnerabilities and Protection Issues .. 8 7.
2 Relevant National Policies and Stakeholders .. 8 References .. 10 List of Figures Figure 1: Origin of Migrants in South Sudan , 2015 .. 2 Figure 2: Destination of Migrants from South Sudan , 2 Figure 3: Total Population in South Sudan by Age Group, 2015 .. 3 Figure 4: Migrant Stock in South Sudan by Age Group, 2015 .. 3 Figure 5: Destination Countries of South Sudanese Refugees, 2017 .. 4 Figure 6: Destination Countries for South Sudanese Migrants, 2013 .. 6 List of Tables Table 1: South Sudan s Key Demographic and Development Indicators .. 1 Table 2: South Sudan s Key Migration Legislation and Policy Responses.
3 9 1 1. Introduction South Sudan borders the Central African Republic to the west, Sudan to the north, Ethiopia to the east, and the Democratic Republic of Congo (DRC), Uganda and Kenya to the South . South Sudan is the youngest nation in the world, becoming independent only in 2011 following remarkable progress between the Comprehensive Peace Agreement in 2005 and the referendum and independence process in 2011 (DAI Europe and EuroTrends, 2015). It has, however, struggled with development and security issues ever since.
4 In 2013, following economic disparity from shutting down oil production plants, a civil war emerged, pushing millions of South Sudanese into a humanitarian crisis. War broke as the Sudan People s Liberation Movement broke into two main factions - Sudan s People Liberation Army (SPLA) and Sudan s People Liberation Army-in Opposition (SPLA-IO) - conflict ensuing between both forces. An internationally mediated peace agreement was achieved in 2015 and a transitional government composed. However, heavy fighting broke out in the capital Juba in July 2016 and is still going on today (RMMS, 2016a).
5 South Sudan has one of the lowest development levels in the world, with its HDI at landing it on position 181 in the global ranking of 188 countries (UNDP, 2016). Its population was estimated at million in 2016 (CIA, 2017). Many development indicators such as employment rates are unknown due to the country s young age and political instability. However, the adult literacy rate is at 32 per cent and its GDP per capita (PPP in 2011) is as low as USD 1,657 (UNDP, 2016; IMF, 2017). Table 1: South Sudan s Key Demographic and Development Indicators Indicator South Sudan Total area, in sq kma 644,329 Population (2015), in millionb Urban Population (2015), % of totalc Population Growth Rate, annual %d Ethnic Groupsa Dinka Nuer Other Human Development Index (2015), country rank out of 188e 181 GDP Based on PPP per Capita, current international dollars per capitaf Life Expectancy at Birth (2015), yearse unemployment (2015), % of labour forcee Source: CIA, 2017.
6 2 youth unemployment (2015), % ages 15-24e Multidimensional Poverty Headcount (2010), %e Gini Coefficient (2010-2015)e Foreign Direct Investment (net inflows, 2015), current USD millionsd Net Official Development Assistance Received (13), current USD millionsd Personal Remittances Received (2015), current USD millionsd a CIA, 2017; b UN DESA, 2015b; c UN DESA, 2014; d World Bank, 2017; e UNDP, 2016; f IMF, 2017. Migration wise, South Sudan is an origin and destination country of forced migrants and a transit country for irregular migration routes.
7 The refugee situation in South Sudan has reached unprecedented level, as estimates from May 2017 show that there are close to million South Sudanese refugees and asylum seekers, coming from both pre and post 2013 (UNHCR, 2017a). Uganda hosts by far the largest number of South Sudanese refugees at, currently, 898,138 (UNHCR, 2017b). Prior to the conflict, as 2013 estimates show, South Sudan s estimated emigration stock was 751,900, demonstrating the impressive escalating features of the conflict (World Bank, 2016). Emigration at 2013, thus before the civil war, had different destinations than current forced displacement trends have.
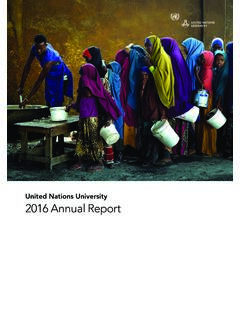
8 In 2015, according to UN DESA, the emigration stock was 634,613, which must be taken with great caution, as the developing refugee situation demonstrates. The top destinations are Ethiopia, Sudan and Kenya as Figure 2 demonstrates (UN DESA, 2015a). Despite the current conflict, South Sudan is also considered a destination country for migrants, asylum seekers and refugees. UN DESA estimates state that as of 2015 the country had a migrant stock of 824,122 (UN DESA, 2015a). Remarkably, after its independence in 2011, hundreds of thousands of displaced South Sudanese returned to the nation and neighbouring countries, like Sudan .
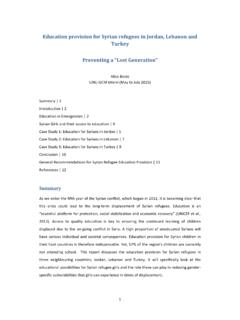
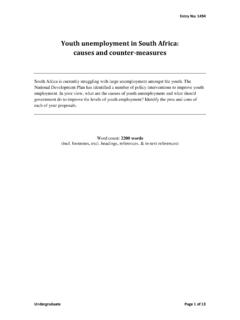
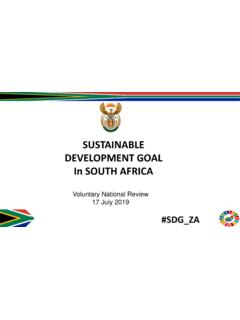
9 Some resettled in urban areas, while many continue to live in a situation of internal displacement (RMMS, 2016a). In 2015, the main origin Nations of immigrants were Sudan , Uganda and the DRC as Figure 1 shows. Figure 1: Origin of Migrants in South Sudan , 2015 Source: UN DESA, 2015a. Figure 2: Destination of Migrants from South Sudan , 2015 Source: UN DESA, 2015a. Comparing the population pyramids of the South Sudanese population and the immigrant stock, Figure 3 and 4 respectively, a few differences appear. There are a large number of migrant children (5-9) different from infants (0-4) which shows refugees from neighbouring countries looking for shelter there, who would not have children at camps but rather move when they are already of some age.
10 At the same time, the overall share of adults is higher among the migrants than among the natives (UN DESA, 2015a). Figure 3: Total Population in South Sudan by Age Group, 2015 Source: UN DESA, 2015a. Figure 4: Migrant Stock in South Sudan by Age Group, 2015 Source: UN DESA, 2015a. 2. Forced Migration/ Displacement Forced migration is the most important point of analysis of migration trends in South Sudan , as its displacement situation reaches unprecedented levels raising it to a grave humanitarian crisis. Refugees in South Sudan As of July 2016, there were 259,796 refugees and asylum seekers in South Sudan .