Transcription of SPECIFIC GRAVITY, WEIGHT, AND SOLIDS …
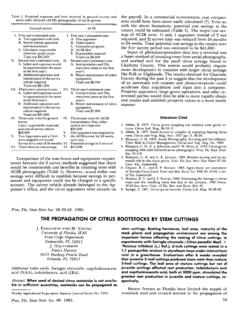
1 268 FLORIDA STATE HORTICULTURAL SOCIETY, 1961 SPECIFIC gravity , weight , AND SOLIDS RELATIONSHIPS IN WATERMELONS R. K. Showalter Florida Agricultural Experiment Station Gainesville Watermelons show little external evidence of maturity changes. The importance of the matur ity and eating quality relationship has been established, but a non-destructive method for measuring maturity has not been developed. As watermelons grow and mature they in crease in weight and total soluble SOLIDS . Dif ferences in variety and environment also af fect the SOLIDS content (7). In some fruits and vegetables changes in den sity and composition have been correlated with SPECIFIC gravity (1), (4), (10).
2 SPECIFIC gravity determinations were closely related to total SOLIDS and quality in potatoes and sweet corn. In tomatoes, Nettles (5) found signifi cant correlations, but no practical significance Florida Agricultural Experiment Stations Journal Series, No. 1372. between SPECIFIC gravity and soluble SOLIDS or maturity. relationship between fruit size and SPECIFIC gravity has been reported (10). In studies of fruit size, smaller oranges (2) and grapefruit (3) had higher SOLIDS than the larger fruits, but the reverse was true for apples (11). The watermelon industry in Florida recently contemplated regulating the maturity of water melons shipped from the state. In 1961 ad ditional data on SPECIFIC gravity measurements were obtained to supplement that obtained in 1957 by the author (8).
3 Other information was limited to Strietelmeier's 1959 study (9) which showed that separation of maturities by SPECIFIC gravity was not practical. The pur pose of this paper is to present information on the feasibility of using SPECIFIC gravity for measuring maturity of watermelons, and to show some relationships between total soluble SOLIDS and melon size ( weight basis). Table 1. Relationships of SPECIFIC gravity , Total Soluble SOLIDS , and Melon weight Among 15 Lots of Watermelons of Three Varieties Ranked by Increasing Soluble SOLIDS . Lot Number Melons Average SPECIFIC gravity Average Soluble SOLIDS Percent Charleston Gray Variety 1957 Season 45 50 49 49 48 49 50 47 0,941 Charleston Gray Variety 1961 Season 9 10 11 30 27 30 Congo Variety 1957 Season 12 42 13 45 Blackstone Variety 1957 Season 14 15 50 42 Significant at 5% level Significant at 1% level Average Melon weight tf Correlation Coefficients SPECIFIC gravity and Soluble SOLIDS * * ** * +.
4 596 * Melon weight and Soluble SOLIDS +.493 +.654 * +.397 * ' +.205 +.471 * +.334 * +.413 +.422 * +.503 +.393 + .235 + .179 +.414 +.389 SHOWALTER: watermelon STUDIES 269 Experimental Procedure Twelve lots of 50 watermelons each, of Charleston Gray, Congo and Blackstone varie ties, were obtained from commercial growers in North-Central Florida in 1957. Three addi tional lots (30 each) of Charleston Gray melons were obtained in 1961. These melons were selected at random to represent the varying maturities and sizes harvested for shipment. After the melons were cut, those with hollow heart were excluded from the tests. SPECIFIC gravity was determined gravimetric-ally.
5 This method was the most precise and rapid for oranges and cabbage (6), (10). The melons were held in storage about one-half day before weighing in air and water for the melons and the water to equalize in tempera ture. A holder with attached tare weight was used to submerge the melons. SPECIFIC gravity (S) was calculated from the formula, Wj - weight in air W2 weight of tare in water - weight of tare and melon in water Total soluble SOLIDS were determined with a hand refractometer using juice expressed from a few cubic inches of flesh at the center of each melon. Additional data were obtained on the relationship of soluble SOLIDS and melon weight from seven lots of melons harvested in 1955.
6 These melons were harvested for other purposes and many were overripe. The relationships studied in 1955 were limited to ripe or overripe melons instead of the range of maturities studied in 1957 and 1961. Results The watermelons obtained from 12 different growers in 1957 varied widely in maturity as shown by the range in total soluble SOLIDS (Table 1). The data, ranked according to in creasing soluble SOLIDS , showed a corresponding decrease in SPECIFIC gravity among most of the lots. This negative relationship was found among all three varieties in the 1957 tests and the Charleston Gray melons in the 1961 tests. Correlation analyses between SPECIFIC gravity and soluble SOLIDS for the 653 melons in all tests resulted in negative coefficients for 14 of the 15 lots.
7 Ten of the coefficients were statisti cally significant, but none of them exceeded Although SPECIFIC gravity generally de creased with increased SOLIDS , the reverse re lationship was found in one lot mean, and among many individual melons in all lots. When the soluble SOLIDS of all melons from the 15 lots were classified into 8 ranges (Table 2), the average SPECIFIC gravities also decreased with increasing SOLIDS . The only exceptions were found in the Charleston Gray and Blackstone melons in the lowest SOLIDS groups. Thus, Charleston Gray melons with SOLIDS of to percent had the same SPECIFIC gravity as those with SOLIDS of to percent. Strietelmeier (9) also found that immature melons had the same SPECIFIC gravities as mature melons.
8 Average melon size on a weight basis increas ed with increasing SOLIDS among most lots (Table 1). Correlation coefficients between melon weights and soluble SOLIDS were positive for all 15 lots, and these coefficients were slightly higher than those for SPECIFIC gravity Table 2. Distribution of SPECIFIC gravity and Melon Weights of Three Varieties of Watermelons Among Eight Ranges of Total Soluble SOLIDS . 1957 and 1961 Seasons. ""TaEaT Soluble SOLIDS Range Percent * 8 Variety Char leston Specif Gray NumberSpecificWeight Melons gravity Lbs. 3 15 24 72 167 118 72 3 3 18 41 18 7 weight Lbs. Blackstone Specif NumberSpecific weight Melons gravity Lbs.
9 2 7 21 46 16 270 FLORIDA STATE HORTICULTURAL SOCIETY, 1961 Table 3. Relationships of Total Soluble SOLIDS and Melon weight of Two Varieties of Watermelons Classified by Maturity. Lot No. Number Melons Maturity Charleston Grav Variety 1955 Season Average Soluble SOLIDS Percent 1 A 1 B 2 A 2 B 3 A 3 B 4 5 Ripe Overripe Ripe Overripe Ripe Overripe Ripe Ripe 22 36 31 29 32 28 51 43 Average """ """ Melon Correlation weight Melon weight and Lbs. Soluble SOLIDS +.261 +.232 +.344 +.337 +.252 Conao Variety 1955 Season 6 A 6 B Ripe Overripe Ripe 30 30 52 M +.372 Significant at 5% level Significant at 1% level Table 4.
10 Distribution of watermelon Weights of Two Varieties and Two Maturities Among Seven Ranges of Total Soluble SOLIDS . 1955 Season. Total Soluble SOLIDS Range Percenjt 9 9 9 9 Charleston Ripe Number Melons 2 12 49 83 32 1 weight Grav Vari etv Overripe Number Melons mm 1 13 37 40 2 weight Lbs. Ril dumber Melons 1 5 17 40 18 1 Congo De weight Lbs. Variety Overripe Number Melons * -9 16 5 weight Lbs.,, and soluble SOLIDS . The relationships of melon weights to the 8 ranges of soluble SOLIDS in Table 2 showed considerable increases in weight for all three varieties as the melons became more mature. In contrast, the weights did not change with increasing SOLIDS among melons of a similar degree of ripeness (Table Correlation coefficients between SPECIFIC grav ity and melon weights calculated for the 1961 Charleston Gray melons revealed negative re lationships (.))


![INDEX [www.brammerstandard.com]](/cache/preview/6/7/1/6/b/b/8/c/thumb-6716bb8cd0517fca7d7bc952802a8144.jpg)