Transcription of SPECTROPHOTOMETRY AND SPECTROMETRY - CONCEPT …
1 Vol-2 Issue-4 2017 IJARIIE-ISSN(O)-2395-4396. SPECTROPHOTOMETRY AND. SPECTROMETRY - CONCEPT AND. APPLICATIONS. Renjini A1, Dani Dileep2. 1. Assistant Professor, Department of ECE, Rajadhani Institute of Engineering and Technology, Kerala, India 2. PG scholar, Department of Optoelectronics, University of Kerala, Kerala, India ABSTRACT. SPECTROPHOTOMETRY is a technique which measures how much a substance absorbs light by measuring the intensity of light, as a beam of light passes through it. The basic principle is that every compound absorbs or transmits light over a certain range of frequencies (wavelengths). If we take a measure of this, it could be used to measure the amount of a known substance in an unknown medium. SPECTROPHOTOMETRY is one of the most useful methods of quantitative analysis in various fields such as chemistry, physics, biochemistry, forensic science, agriculture, material and chemical engineering and clinical applications.
2 A spectrometer gives the detail of exactly which all wavelengths of light are absorbed and which all wavelengths of light are reflected whereas a spectrophotometer gives a comparative measure by measuring the relative intensity of the light absorbed or reflected at a particular wavelength of light. Spectrometric and spectrophotometric techniques can be used for a wide range of elemental and compositional analyses that provide a very high and accurate detection limits in the sub-ppm level of chemical compound which could be made useful in various applications. Some of the spectrophotometers can be used to monitor the separations obtained while doing liquid chromatography and some others could be used for colour selection and printing. Optimum balance of NPK in soil and protein concentration in various substances can also be monitored by the use of spectrometers.
3 Thus there are many key areas where SPECTROMETRY and SPECTROPHOTOMETRY are used like pharmacology, industries, agriculture, printing, painting and much more of which some of them are detailed in this paper. Keyword: - SPECTROPHOTOMETRY , spectrometer, chromatography 1. INTRODUCTION. We know that every compound absorbs, transmits, or reflects light (electromagnetic radiation) over a certain range of wavelength. SPECTROPHOTOMETRY is a measurement of how much a substance absorbs or transmits light [1]. SPECTROPHOTOMETRY is widely used for quantitative analysis in various areas of science and engineering. Any application that deals with substances or materials can use this technique for quantitative as well as qualitative analysis . In biochemistry, for example, it is used to determine enzyme-catalyzed reactions. In clinical applications, it is used to examine blood or tissues for clinical diagnosis [2].
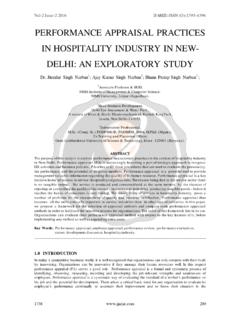
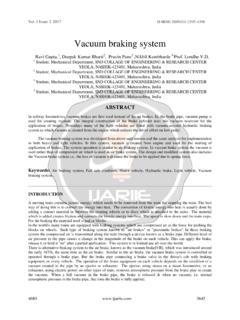
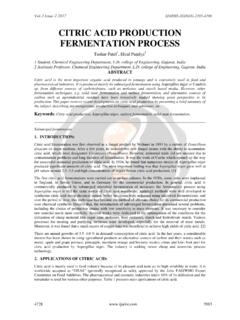
4 There are also several variants in SPECTROPHOTOMETRY such as atomic absorption SPECTROPHOTOMETRY and atomic emission SPECTROPHOTOMETRY which are used for routine measurements in hospitals, petrochemical industry, food industry, water quality (both purity monitoring and purification) control labs, chemical and biological plants etc. Depending on the range of wavelength of light source, a spectrophotometer can be classified basically into two different types: UV-Visible spectrophotometer: uses light over the ultraviolet range (185 - 400 nm) and visible range (400-700 nm) of electromagnetic radiation spectrum. IR spectrophotometer: uses light over the infrared range (700-1300 nm) of electromagnetic radiation spectrum. C-1528 96. Vol-2 Issue-4 2017 IJARIIE-ISSN(O)-2395-4396. Fig 1 shows the UV, IR and visible range of frequencies in the electromagnetic spectrum.
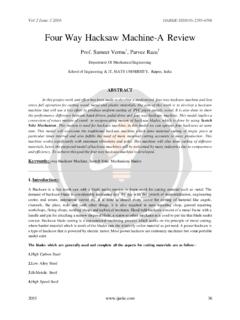
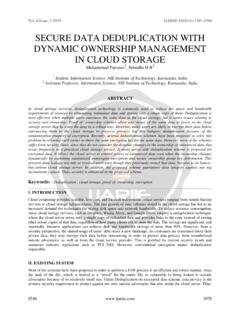
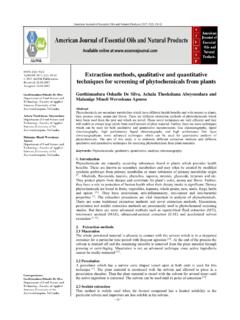
5 Fig 1: Spectrum showing UV, Visible and IR range of frequencies In visible SPECTROPHOTOMETRY , the absorption or the transmission of a certain substance can be determined by the observed color. For instance, a solution sample that absorbs light over all visible ranges ( , transmits none of visible wavelengths) appears to be black in theory. On the other hand, if all visible wavelengths are transmitted ( , absorbs nothing), the solution sample appears to be white. If a solution sample absorbs red light (~700 nm), it appears green because green is the complementary color of red [3]. Visible spectrophotometers, in practice, use a prism to attenuate a certain range of wavelength (to filter out other wavelengths) so that the particular beam of light is passed through a sample substance under test [4]. 2. STRUCTURE AND MECHANISM. Fig 2 illustrates the basic structure of spectrophotometer.
6 It consists of a source of light, a collimator, a monochromator, a wavelength selector, a cuvette for sample solution, a photo detector, and a digital display or a meter. Fig 2: Basic structure of spectrophotometer (illustrated by Heesung Shim). A spectrophotometer, in general, consists of two devices; a spectrometer and a photometer. A spectrometer is a device that produces, typically disperses and measures light. A photometer will usually be a photo detector that measures the intensity of light [4]. Spectrometer: It produces a desired range of wavelength of light. First a collimator (lens) transmits a straight beam of light (photons) that passes through a monochromator (prism) to split it into several component wavelengths (spectrum). Then a wavelength selector (slit) transmits only the desired wavelengths, as shown in Fig 2. Photometer: After the desired range of wavelength of light passes through the solution of a sample in cuvette, the photometer detects the amount of photons that is absorbed and then sends a signal to a galvanometer or a digital display.
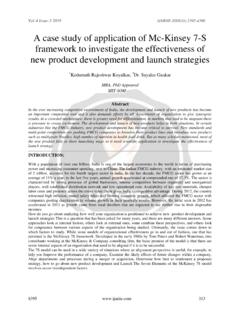
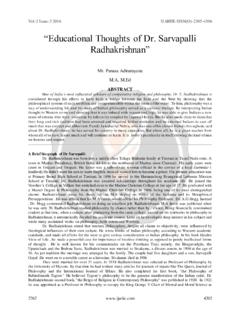
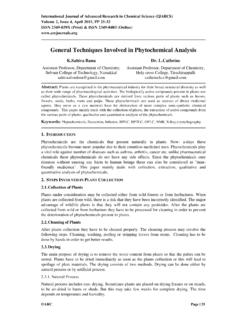
7 A spectrometer produces a variety of wavelengths because different compounds absorb best at different wavelengths. Once the intensity of light is known after it is made to pass through the cuvette, it could be related to the transmittance (T). C-1528 97. Vol-2 Issue-4 2017 IJARIIE-ISSN(O)-2395-4396. Transmittance is the fraction of light that passes through the sample as shown in Fig 3. This can be calculated using the equation (1) as, Transmittance, T = It/I0 -------------- (1). It is the light intensity after the beam of light passes through the cuvette and I o is the light intensity before the beam of light passes through the cuvette. Fig 3: Transmittance As far as IR SPECTROPHOTOMETRY is considered, IR radiation does not have enough energy to induce electronic transitions as seen with UV. Absorption of IR is restricted to compounds with small energy differences in the possible vibrational and rotational states.
8 For a molecule to absorb IR, the vibrations or rotations within a molecule must cause a net change in the dipole moment of the molecule. The alternating electrical field of the radiation interacts with fluctuations in the dipole moment of the molecule. If the frequency of the radiation matches the vibrational frequency of the molecule then radiation will be absorbed, causing a change in the amplitude of molecular vibration [5]. These vibrational levels are quantized, and absorption of IR by gases yields a line spectra. However, in liquids or solids, these lines broaden into a continuum due to molecular collisions and other interactions. Transmittance is related to absorption by the expression in equation (2). Absorbance, A = -log (T) = -log (It/I0) ------------ (2). 3. APPLICATIONS. In Pharmacological Laboratories In laboratories, UV and Visible spectrophotometers can be used to monitor the separations obtained while doing liquid chromatography.
9 If a mixture is separated in columns, spectrophotometers can be used to detect the different compounds. Using a spectrophotometer is relatively cheap and an easy detector method compared to mass SPECTROMETRY detectors. Many illegal drugs contain aromatic groups that produce characteristic UV/Visible spectra. As the absorption peak depends on the nature of the aromatic group(s) in the drug compound, additional spectroscopic information regarding drug derivatives and their metabolites will be obtained. In Digital printing Spectrophotometers are widely used in digital printing technique for colour selection and confirmation. A spectral reflectance curve is obtained by taking the readings at every 10 nm along the visible wavelengths (400 - 700nm). These curves confirm a particular colour to a given specification. The colour management process requires a reference colour data set and softwares for analysing the measured data in addition to a spectrophotometer.
10 In Agriculture In the field of agriculture, production of the crop, water and nutrition management etc. are directly knotted with maintaining the optimum balance of nitrogen, phosphorus, and potassium in the soil for the specific crop concerned with. The correct nutrient levels together with correct soil pH levels also support nutrient availability, organic matter decomposition, and overall soil fertility balance [6]. Spectrophotometer acts as an important tool for monitoring the C-1528 98. Vol-2 Issue-4 2017 IJARIIE-ISSN(O)-2395-4396. nitrogen and phosphorus levels in fertilizers and soil compounds. The molybdenum blue phosphate method in conjugation with UV Visible spectrophotometer is used to determine the amount of phosphate. The added molybdate forms phosphomolybdate complex followed by the reduction of the complex with hydrazine hydrate in aqueous sulphuric acid medium.