Transcription of Spectroscopy Experiment - Kalamazoo Valley Community …
1 Spectroscopy Experiment Light interacts with matter. The study of this interaction is called Spectroscopy . Much of the information about the nature of matter and atomic electron configurations has been determined by spectroscopic methods. Light is electromagnetic radiation, a form of energy that moves at the speed of light. The energy of light is dependent on its wavelength and frequency. Common types of Spectroscopy are infrared IR, ultra-violet UV, and visible Spectroscopy . In this Experiment the absorption of light will be measured in the visible portion of the electromagnetic spectrum. Substances that have visible color absorb some portion of the visible region of the electromagnetic spectrum.
2 Chlorophyll appears green because it is absorbing red light (at about 655 nm) and violet light (at about 430 nm), while transmitting or reflecting the yellow, blue and green wavelengths. The light at 655 nm and 430 nm absorbed by chlorophyll provides the energy for photosynthesis. The green color of chlorophyll is a qualitative measurement of the substance. Many metal ions such as aluminum, chromium, iron, and cobalt can be analyzed by visible Spectroscopy . The metal ion is extracted from the sample and prepared for analysis. Today we will be determining the absorbance spectrum for the cobalt (II) ion and determining the concentration of cobalt (II) chloride in unknown samples.
3 Cobalt (II) chloride is often used to detect moisture. The anhydrous form of cobalt chloride is blue, while the hydrated form cobalt (II) chloride hexahydrate is pink. It is sometimes used as invisible ink. Using an eyedropper, drop several drops of the cobalt chloride solution on a paper towel. Observe the color as the paper towel dries. Did the cobalt chloride change colors? Cobalt can be found in batteries, alloys, drill bits and machine tools, dyes and pigments as cobalt blue, magnets, and tires. Cobalt is also a component of vitamin B12, an essential vitamin. The concentration of a substance will influence the degree of absorption; therefore, the measurement of light absorbed can be used to determine the concentration of a substance.
4 Beer's Law states that absorbance A is proportional to concentration c in the equation: A = k c . Graphing absorbance vs. concentration should yield a straight line with a slope of k. An absorbance spectrum and a standard calibration line (or Beer's Law plot) is shown in the sample data section below. Objectives: 1. Calibrate and use a UV-VIS spectrophotometer to measure absorbance. 2. Measure the absorption spectrum of two different substances in the visible range. (Absorbance vs. wavelength). 3. Prepare several dilutions from a known standard solution. 4. Calculate the concentration of each dilution from M1V1 = M2V2.
5 5. Determine the standard calibration line or Beer's law plot (absorbance vs. concentration) for the dilutions. 6. Determine the concentration of an unknown solution. 7. Investigate the flame emission spectrum of several metal ions in aqueous solutions. Chemicals: Aqueous stock solutions of known concentration of two different ions: Co2+ and FeSCN2+ preferred. [If these are not available Ni2+, Cr2+, MnO41-, OR Cr2O72- can be substituted.]. For flame Spectroscopy : BaCl2, SrCl2, CaCl2, CuCl2, LiCl, KCl, and NaCl solutions Burets of .150 M CoCl2 and supplied by stockroom Equipment: Cuvettes Spectrophotometer Small test tubes Test tube rack Wooden coffee stirrers Ignitor Bunsen burner Prior to attending lab, read the sections of our textbook dealing with spectrophotometry (in Chapter 4); and wavelength, frequency, and energy in (Chapter 6).
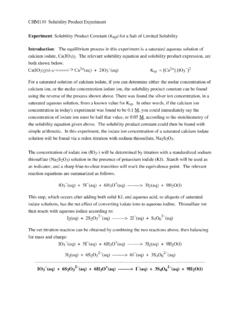
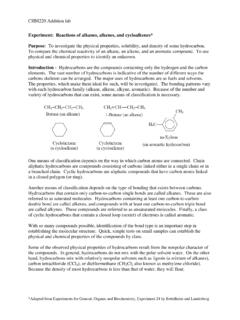
6 Sample Data Analysis The absorbance spectrum of an aqueous solution of chromium III ion, Cr3+ was taken at nine different wavelengths, from 400 to 600 nm. The spectrum was determined for two solutions of different concentrations. Below is a table of the data, followed by the absorbance spectrum. Absorbance of M. Wavelength Cr3+ Absorbance of M Cr3+. 400 425 450 475 500 525 550 575 600 Wavelength of Maximum Absorbance Lambda Max = 575 nm A maximum in absorbance occurs at 575 nm. This wavelength is used to determine the relationship between absorbance and concentration. The graph of absorbance versus concentration at a constant wavelength is called a standard calibration line or "Beer's law plot".
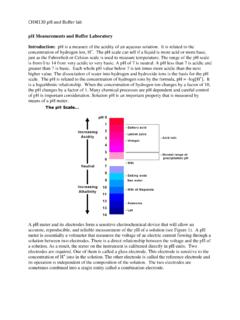
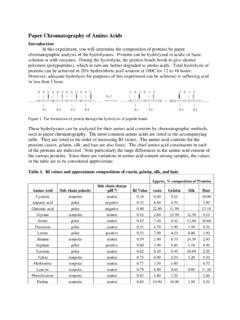
7 The standard solutions are prepared as dilutions from a concentrated solution of known concentration. The concentration of each dilute solution is calculated from McVc=MdVd or M1V1=M2V2. Following is a data table and a standard calibration line. Sample # Absorbance Concentration(M). 0 0 0. 1 2 3 4 5 6 The data in the table above was plotted below. The graph "fits" the data to the equation of a straight line. It uses the format, y = mx + b. In this equation the slope is the value of m. The slope has units of absorbance per molarity, or liters per mole (inverse of molarity). Beer's law A = k c relates absorbance to concentration.
8 A is absorbance measured with the spectrophotometer. Absorbance is a unitless value, k is the slope of the line, when absorbance is plotted versus concentration, and c represents concentration in moles per liter. For the graph above, the Beer's law equation A = k c would be: A = c The concentration of an unknown solution can be found by rearranging the equation: c = A/ k = A If an unknown solution has an absorbance of .412, its concentration would be calculated as: c = .412 = .0268 moles/liter This Experiment contains several parts. Each part has instructions and a worksheet to enter collected data and make calculations.
9 Calibrating or Standardizing the Genesys 20 spectrophotometer The spectrophotometer must be calibrated with a water blank before using it and each time the wavelength is changed. Determination of the absorption spectrum. The absorbance of two different metal ions will be measured at different wavelengths in the visible spectrum. A standard calibration line or Beer's law plot of absorbance versus concentration Several dilutions will be prepared from a solution of known concentration of one of the metal ions. The concentration of the diluted solutions will be calculated from the known concentration of the standard solution, using the equation McVc = MdVd or M1V1 =.
10 M2V2 . The absorbance of each diluted solution will be measured at the wavelength of maximum absorbance. Absorbance will be graphed against concentration to determine the slope of the line. Determination of the concentration of an unknown The absorbance of an unknown solution will be measured. Concentration will be calculated using information obtained from the standard calibration line. Flame emission spectrum The flame emission spectrum of several metal ions will be studied. Download Data Spreadsheet. Calibrating or Standardizing the Genesys 20 spectrophotometer: Plug the spectrophotometer in and turn it ON with the switch in the back.