Spectroscopy tables - Michigan State University
Table 13.2 Regions of the IH NMR Spectrum Halogen Chemical shift (ô) c— / I Allylic c Saturated I Aromatic c=c Vinylic Table 13.3 Correlation of IH Chemical Shift with Environment ... Type of hydrogen Alcohol 0.7-1.3 Alcohol, ether 1.6-2.2 Vinylic 2.0—2.4 Aryl 2.4-2.7 Aldehyde 2.5-3.0 2.5—4. Carboxylic acid —CH3 —CH2— CH c Ar ...
Tags:
Information
Domain:
Source:
Link to this page:
Documents from same domain

Principles of FTIR Spectroscopy - Chemistry
www2.chemistry.msu.eduPrinciples of Diffuse Reflectance Method K is the absorption coefficient, and S is the scattering coefficient. In practice, the comparative reflectance r∞ with respect to a standard powder such as KBr or KCl, of which K is near zero (0) in the actual measurement range Spectrum of solid caffeine Measurement of chemicals adhering to a surface ...

Standard Operating Procedure: Pumps
www2.chemistry.msu.eduStandard Operating Procedure: Pumps Last Updated: ... operation of ports and evacuation procedures are covered in the glove box SOP document. As a general
Radiation Detection & Measurement Dept. of …
www2.chemistry.msu.eduRadiation Detection & Measurement Dept. of Chemistry --- Michigan State Univ. National Superconducting Cyclotron Lab DJMorrissey Spring/2oo9

Chemistry 151 - Michigan State University
www2.chemistry.msu.eduChemistry 151 • Professor James H. Geiger • Office: Chemistry Building, Room 9 ... Chemistry, the Central Science, 10th edition, Prentice-Hall, 2005. ISBN: 0-13-109686-9. ... Registering for Mastering Chemistry, What You Need: A valid email address

Chapter 3 Stoichiometry - Michigan State University
www2.chemistry.msu.eduChapter 3! Stoichiometry: Calculations with Chemical Formulas and Equations. Stoichiometry Anatomy of a Chemical Equation CH 4 (g) + 2O 2 (g) CO 2 (g) + 2 H 2 O (g) Stoichiometry Anatomy of a Chemical Equation Reactants appear on the left side of the equation. CH 4 (g) + …

Bond Dissociation Energies of Organic Molecules
www2.chemistry.msu.eduBond Dissociation Energies of Organic Molecules STEPHEN J. BLANKSBY*,† AND G. BARNEY ELLISON*,‡ Department of Chemistry, University of Wollongong, NSW, 2522, Australia, and Department of Chemistry &

Chapter 1 Structure and Bonding - Chemistry
www2.chemistry.msu.eduThe atomic mass (atomic weight) of an element is weighted average mass in atomic mass units (amu) of an element’s naturally occurring isotopes. Carbon: Atomic Number and Atomic Mass 12C 6 AC Z 13C 6 (98.9 12.000) (1.1 13.000) 12.011 100 × +× =

Chapter 9: Atomic Absorption Spectrometry
www2.chemistry.msu.eduChapter 9: Atomic Absorption Spectrometry. Read: pp. 230 – 249 Problems: 9-1,3,5,6,8. Figure 9-13a. A(λ)= ε(λ)bC = log P. o /P

Chapter 24 Chemistry of Coordination Compounds
www2.chemistry.msu.edu6 3+ • Co3+ electron configuration: • 4s23d4----" 4s03d6 • Need six orbitals for six ligands so: !Hybridize 1 4s, 3 4p and 2 3d to give: !Sp3d2 orbitals. The 6 …
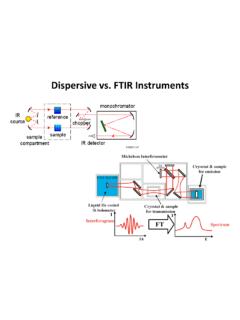
Dispersive vs. FTIR Instruments - Chemistry
www2.chemistry.msu.eduA spectroscopic technique used to observe vibrational, rotational, and other low-frequency [modes in a system. 1] It relies on inelastic scattering, or Raman scattering, of monochromatic light, usually from a laser in the visible, near infrared, or near ultraviolet range.
Related documents
Experiment 7: Spectrum of the Hydrogen Atom
www.columbia.eduPHYS 1493/1494/2699: Exp. 7 – Spectrum of the Hydrogen Atom 2 Introduction The physics behind: The spectrum of light The empirical Balmer series for Hydrogen The Bohr model (a taste of Quantum Mechanics) Brief review of diffraction The experiment: How to use the spectrometer and read the Vernier scale Part 1: Analysis of the Helium (He) spectrum

PHYS201 - Wave Mechanics - Macquarie University
physics.mq.edu.auBlack body spectrum Spectra of the elements photoelectric effect Specific heat of solids . . . ... The electron in a hydrogen atom should spiral into the ... n = 1;2;::: Semester 1 2009 PHYS201 Wave Mechanics 7 / 86. The Bohr model of the hydrogen atom II Bohr radius — radius of lowest energy orbit — a0 =r1 0h2 ˇe2m e 0.05 nm. The atom ...
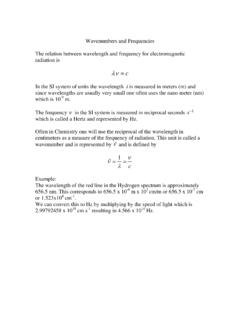
Wavenumbers and Frequencies - Chemistry
www2.chemistry.msu.eduThe wavelength of the red line in the Hydrogen spectrum is approximately 656.5 nm. This corresponds to 656.5 x 10-9 m x 102 cm/m or 656.5 x 10⁻⁷ cm or 1.523x104 cm-1. We can convert this to Hz by multiplying by the speed of light which is 2.99792458 x 10. 10. cm s-1. resulting in 4.566 x 10. 14. Hz.

Emerson Hydrogen Fuel Brochure
www.emerson.comWith growing interest in hydrogen-powered vehicles and power systems, and the push for greener energy, the demand for hydrogen is greater than ever before. Producers of hydrogen fuel need electrolyzers to operate more efficiently and reliably to meet the increased market demand. Customers are also demanding hydrogen with higher purity.
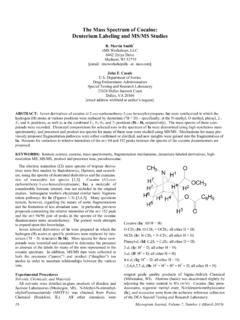
The Mass Spectrum of Cocaine: Deuterium Labeling and …
www.dea.govthat in the spectrum of the D-labeled derivative. A compilation of m/z values for selected peaks in the spec-trum of Ia and for the corresponding peaks in the spectrum of each of the derivatives is shown in Table I. In many cases, each peak in the spectrum of Ia can be correlated to a single peak in the spectrum of each derivative.

Disinfectants Comparison Chart - Northern Arizona University
www7.nau.eduHydrogen Peroxide (hydrogen peroxide /anionic surfactants) Botanicals Example- Benefect – Thymol Silver Dihydrogen Citrate Example - PureGreen 24 Storage •If used for disinfecting purposes, bleach should not be stored longer than 3 months. When mixed with water the solution is only effective as a disinfectant for 24 hours.3 Stable in storage.
Sodium Atomic Emission Spectrum - University of California ...
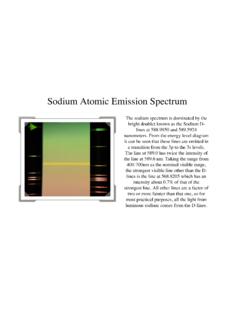
www.chem.uci.eduSodium Atomic Emission Spectrum The sodium spectrum is dominated by the bright doublet known as the Sodium D-lines at 588.9950 and 589.5924 nanometers. From the energy level diagram it can be seen that these lines are emitted in a transition from the 3p to the 3s levels. The line at 589.0 has twice the intensity of the line at 589.6 nm.
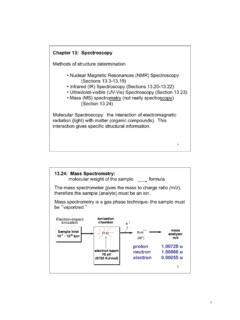
13.24: Mass Spectrometry - College of Arts and Science
as.vanderbilt.edu10-7 3 γ Rays X-Rays Ultraviolet 10-11 10-9 10-5 14 13.2: Principles of Molecular Spectroscopy: Quantized Energy Levels molecules have discrete energy levels (no continuum between levels) A molecule absorbs electromagnetic radiation when the energy of photon corresponds to the difference in energy between two states 7