Transcription of Sponsored in part by - dailylivestockreport.com
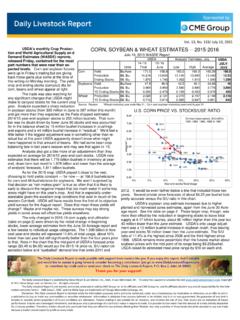
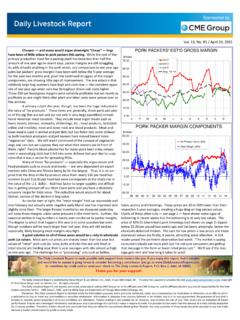
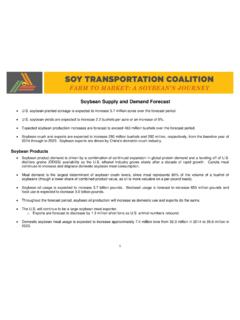
1 Sponsored in part by Copyright 2018 Steiner Consul ng Group, DLR Division, Inc. All rights reserved. Vol. 16, No. 49 / March 9, 2018. Normally we do not expect USDA to make any signi cant updates Corn Supply and Use to its corn balance sheet in March but the recent pace of corn exports caused the latest USDA numbers to vary signi cantly from expecta ons. Prior to the 2015/16 2016/17 2017/18 % Change 2018-19. report analysts polled by Reuters said they expected US corn ending stocks for USDA USDA USDA USDA vs. vs. USDA Outlook the 2017-18 marke ng year to be billion bushels, with the low end of the Actual Estimate Feb Est Mar Est 2015/16 2016/17 Forum range at billion.
2 Higher export forecasts were the primary reason for the . reduc on in carryover stocks although USDA also noted an increase in the Planted Harvested amount of US corn for ethanol produc on. An adjustment in exports was Yield per harvested acre warranted given strong export sales in recent weeks. Weekly exports in the four weeks ending March 1 averaged a li le under 40 million bushels per week, Beginning stocks 1,731 1,737 2,293 2,293 2,352. Production 13,602 15,148 14,604 14,604 14,390. 25% less than the same period a year ago. However, net sales during this Imports 68 57 50 50 50. period averaged 70 million bu.
3 Per week, a 140% jump from the same period Supply, total 15,401 16,942 16,947 16,947 16,792. a year ago while outstanding sales at million bushels are currently 12% Feed and residual 5,114 5,467 5,550 5,550 5,475. ahead of last year's levels. It is clear that USDA believes US corn exports will Ethanol for fuel 5,224 5,439 5,525 5,575 5,650. Food, seed and residual 1,424 1,450 1,470 1,470 1,495. remain quite robust for the next three months as South America produc on Domestic use, total 11,763 12,356 12,545 12,595 12,620. falls short of expecta ons. Exports 1,901 2,293 2,050 2,225 1,900.
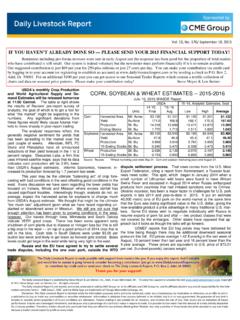
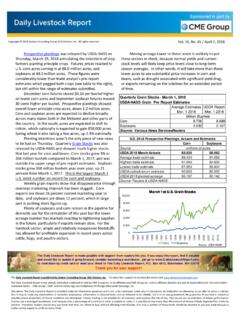
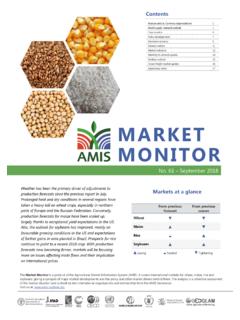
4 In recent years Argen na and Brazil have captured a larger share of Use, total 13,664 14,649 14,595 14,820 14,520. global corn export trade and supply disrup ons there can signi cantly impact Ending stocks 1,737 2,293 2,352 2,127 2,272. demand for US corn. Back in 2000, Argen na and Brazil accounted for 21% of Avg. farm price ($/bu) world corn exports. Last year their share had increased to 36% and this year it Ending Stocks/Use is expected to be 38% of global export volume. Argen na drought condi ons Source: USDA Monthly WASDE Report. 2018-19 USDA Projections are from February USDA Outlook Meeting have worsened in the last two months, leading USDA and other private ** Corn crop marketing year starts September 1.
5 Analysts to signi cantly cut produc on poten al for the country. The latest Main Global Corn Exporters. Share of Total Exports forecast is for Argen ne corn produc on to be 36 million MT, down 3 million Data Source: USDA FAS. MT from the February es mate and 5 million MT (197 million bu.) less than a 100%. year ago. Brazil produc on is currently forecast at million MT, about half 90%. Other a million less than was projected back in February and down 4 million MT from 80%. year ago levels. So at this point USDA expects produc on in these two major Ukraine global suppliers to decline by about 9 million MT Y/Y (around 354 million 70%.)
6 Argentina bushels) and there is poten al for further deteriora on. Indeed, some reports 60%. from Brazil currently project smaller crop than USDA and there does not seem 50%. be any relief for the Argen ne drought. Increasing corn export forecast by Brazil 40%. 175 million bushels and adding another 50 million bushels to ethanol use 30%. meant that ending stocks for 2017-18 are now forecast at billion bushels, s ll a rela vely ample amount but not as burdensome as some were thinking. 20%. USA. The next piece in the puzzle will come when USDA examines the quarterly 10%. stocks data at the end of this month and adjusts, if necessary, the feed and 0%.
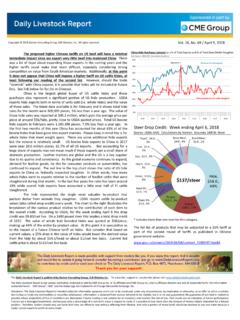
7 Residual es mate. USDA is currently forecas ng a increase in feed/residual use. But producers have had to push ca le into feedlots earlier than expected, which could increase feed demand and hog weights con nue to run signi cantly above year ago levels. Early indica ons for 2018-19 point to soybean exports and carryover stocks for soybean meal were unchanged s ll rela vely ample supplies but they rely on trend yields and lower exports, despite higher exports. S ll, futures markets remain par cularly two major wild cards. concerned about the state of the soybean crop in Argen na. Soybean The balance sheet for soybeans did not present any major surprises meal futures, a key component in hog and poultry diets, have jumped although analysts were expec ng a somewhat smaller carryover stock than 15% in the last four weeks as ght supplies in Argen na come into focus.
8 USDA is now forecas ng. Interes ngly USDA revised lower its es mate for US. The Daily Livestock Report is made possible with support from readers like you. If you enjoy this report, find it valuable and would like to sustain it going forward, consider becoming a contributor. Just go to to contribute by credit card or send your check to The Daily Livestock Report, Box 4872, Manchester, NH 03018. Thank you for your support! The Daily Livestock Report is published by Steiner Consul ng Group, DLR Division, To subscribe, support or unsubscribe please visit The Daily Livestock Report is not owned, controlled, endorsed or sold by CME Group Inc.
9 Or its a liates and CME Group Inc. and its a liates disclaim any and all responsibility for the informa on contained herein. CME Group , CME and the Globe logo are trademarks of Chicago Mercan le Exchange, Inc. Disclaimer: The Daily Livestock Report is intended solely for informa on purposes and is not to be construed, under any circumstances, by implica on or otherwise, as an o er to sell or a solicita- on to buy or trade any commodi es or securi es whatsoever. Informa on is obtained from sources believed to be reliable, but is in no way guaranteed. No guarantee of any kind is implied or possible where projec ons of future condi ons are a empted.
10 Futures trading is not suitable for all investors, and involves the risk of loss. Past results are no indica on of future performance. Futures are a leveraged investment, and because only a percentage of a contract's value is require to trade, it is possible to lose more than the amount of money ini ally deposited for a futures posi on. Therefore, traders should only use funds that they can a ord to lose without a ec ng their lifestyle. And only a por on of those funds should be devoted to any one trade because a trader cannot expect to pro t on every trade.