Example: stock market

SPS Home Stats Tables Durbin Watson 0.05 Table

Durbin - Watson Critical Values - 95% (d) Page 1 of 4 SPS home > Stats Tables > Durbin Watson Table Critical Values for the Durbin - Watson Statistic (d) Level of Significance = .05 n k = l k = 2 k = 3 k = 4 k = 5 dL dU dL dU dL dU dL dU dL dU 6 7 8 9 10 11 12 13 14 15 16 17 18 19 20 21 22 23 24 25 26 27 28 29 30 n = number of observations and k = number of independent variables , Values for the Durbin - Watson Statistic (d) Level of Significance =.

11. 0.20 3.01 . 12. 0.27 2.83 0.17 3.15 . 13. 0.33 2.70 0.23 2.99 0.15 3.27 . 14. 0.39 2.57 0.29 2.85 0.20 3.11 0.13 3.36 . 15

Tags:

  Table, Home, Stats, Watson, Home stats tables durbin watson 0, Durbin, 05 table

Information

Domain:

Source:

Link to this page:

Please notify us if you found a problem with this document:

Other abuse

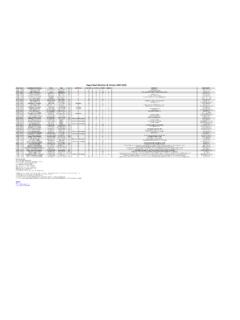
Transcription of SPS Home Stats Tables Durbin Watson 0.05 Table

1 Durbin - Watson Critical Values - 95% (d) Page 1 of 4 SPS home > Stats Tables > Durbin Watson Table Critical Values for the Durbin - Watson Statistic (d) Level of Significance = .05 n k = l k = 2 k = 3 k = 4 k = 5 dL dU dL dU dL dU dL dU dL dU 6 7 8 9 10 11 12 13 14 15 16 17 18 19 20 21 22 23 24 25 26 27 28 29 30 n = number of observations and k = number of independent variables , Values for the Durbin - Watson Statistic (d) Level of Significance =.

2 05 n k = 6 k = 7 k = 8 k = 9 k = 10 dLdUdLdUdLdUdLdUdLdUPage 2 of 4 Durbin - Watson Critical Values - 95% (d)2006-04-27 3 of 4 Durbin - Watson Critical Values - 95% (d)2006-04-27 n = number of observations and k = number of independent variables 4 of 4 Durbin - Watson Critical Values - 95% (d)2006-04-27


Related search queries